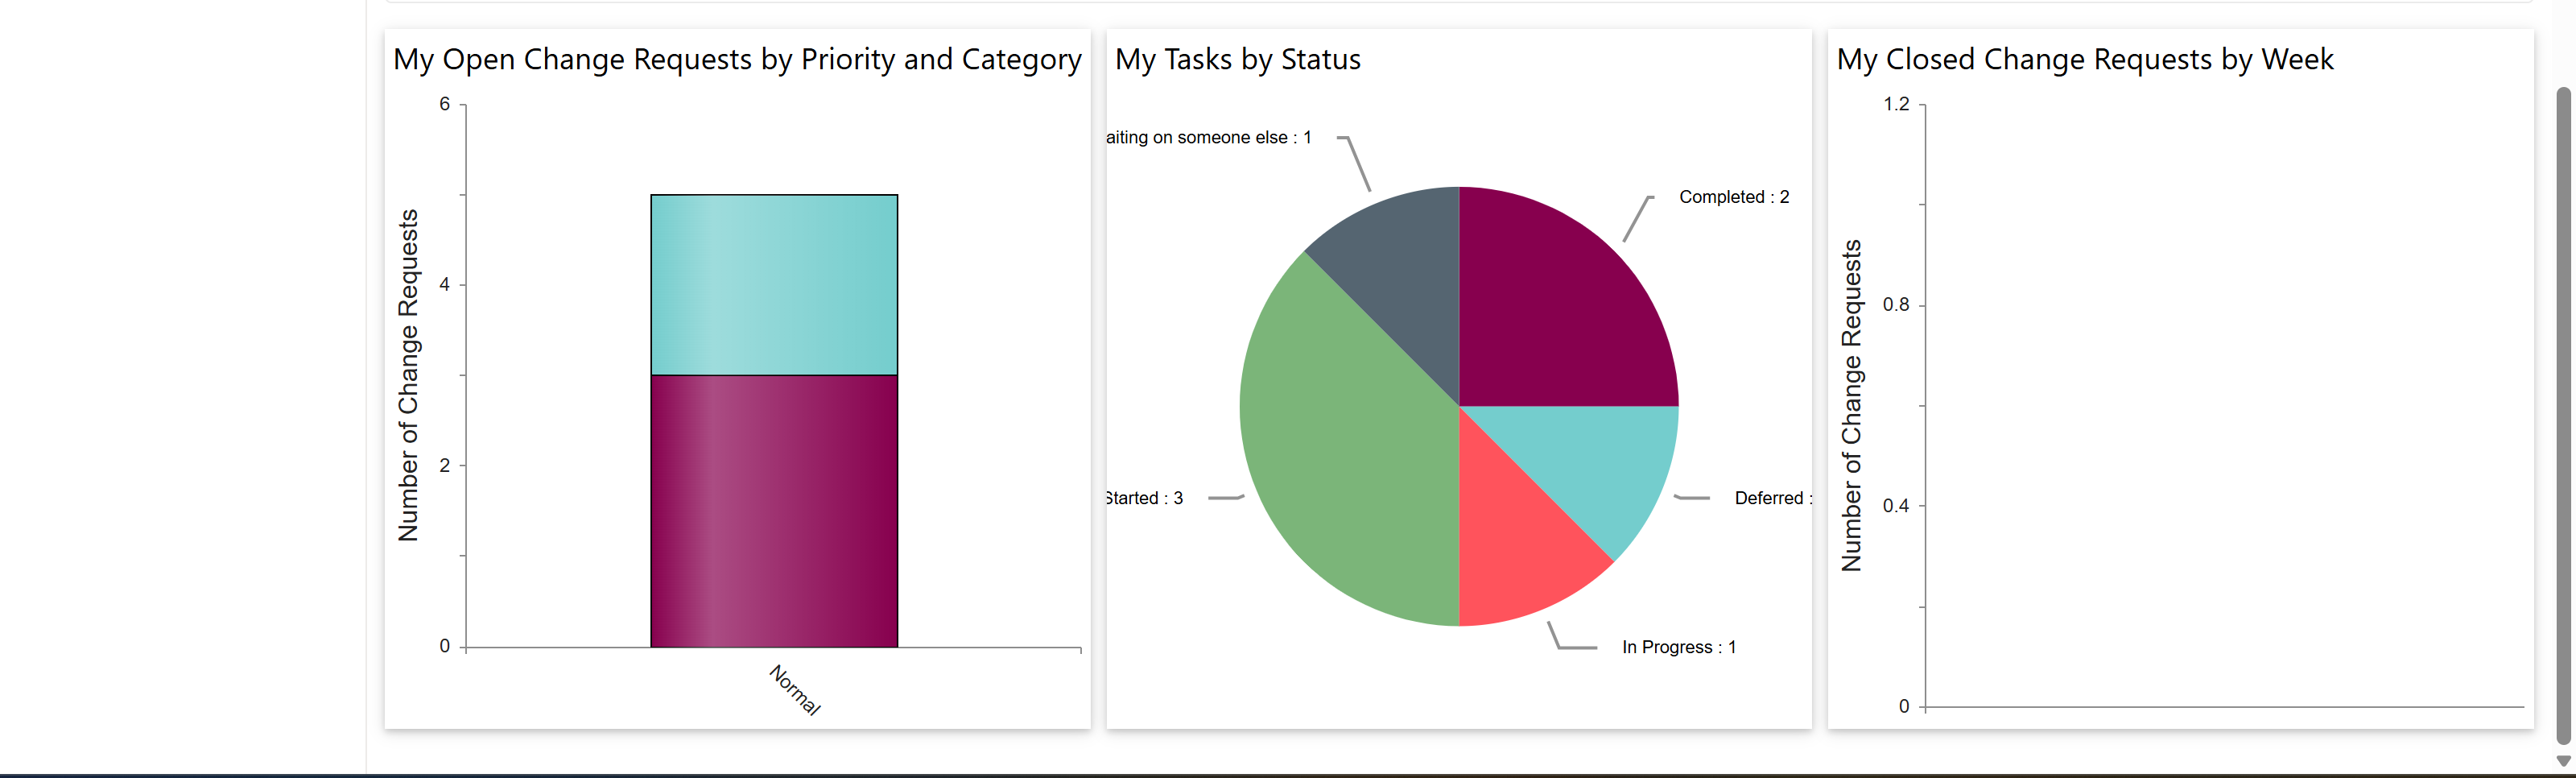
The ‘CR – Staff – Workspace’ dashboard includes the following visual reports:
1.My Open Change Requests by Priority and Category (Bar Chart)
oDisplays the number of currently open change requests.
oCategorized by priority (e.g., Normal) and color-coded by category.
oIn the image, there are 5 open change requests, all marked with Normal priority.
2.My Tasks by Status (Pie Chart)
oShows the distribution of tasks by their status.
oStatuses include: Completed, Deferred, In Progress, Started, and Waiting on someone else.
oUseful for understanding how workload is currently progressing.
3.My Closed Change Requests by Week (Scatter Plot)
oDisplays the number of change requests closed by the staff each week.
oIn the image, no closed change requests are shown, suggesting either no CRs were closed recently, or data has not yet been populated.