Tickets by Period:
Tickets List - Date Period Reports
This page allows you to filter the reports below by date periods (Current or Previous) Then by Range (Month, Quarter, Year, etc).
Simply change the Select Period and Select Range dropdowns on any report below to get the Date Period report desired.
View the report section below based on if you want the reporting date to be the Tickets Created Date or Tickets Closed Date. Then, the columns are stacked by various groupings (Category, Issue Type, or Department).
Tickets Created Date Reports
These reports show how many tickets were created, grouped by different fields:
The top dropdown filters let users pick a date range and period grouping (week/month).
Reports are visual summaries of how many tickets were created/closed, by whom, and in what categories/types.
Helps managers track trends, identify problem areas, and monitor team performance.
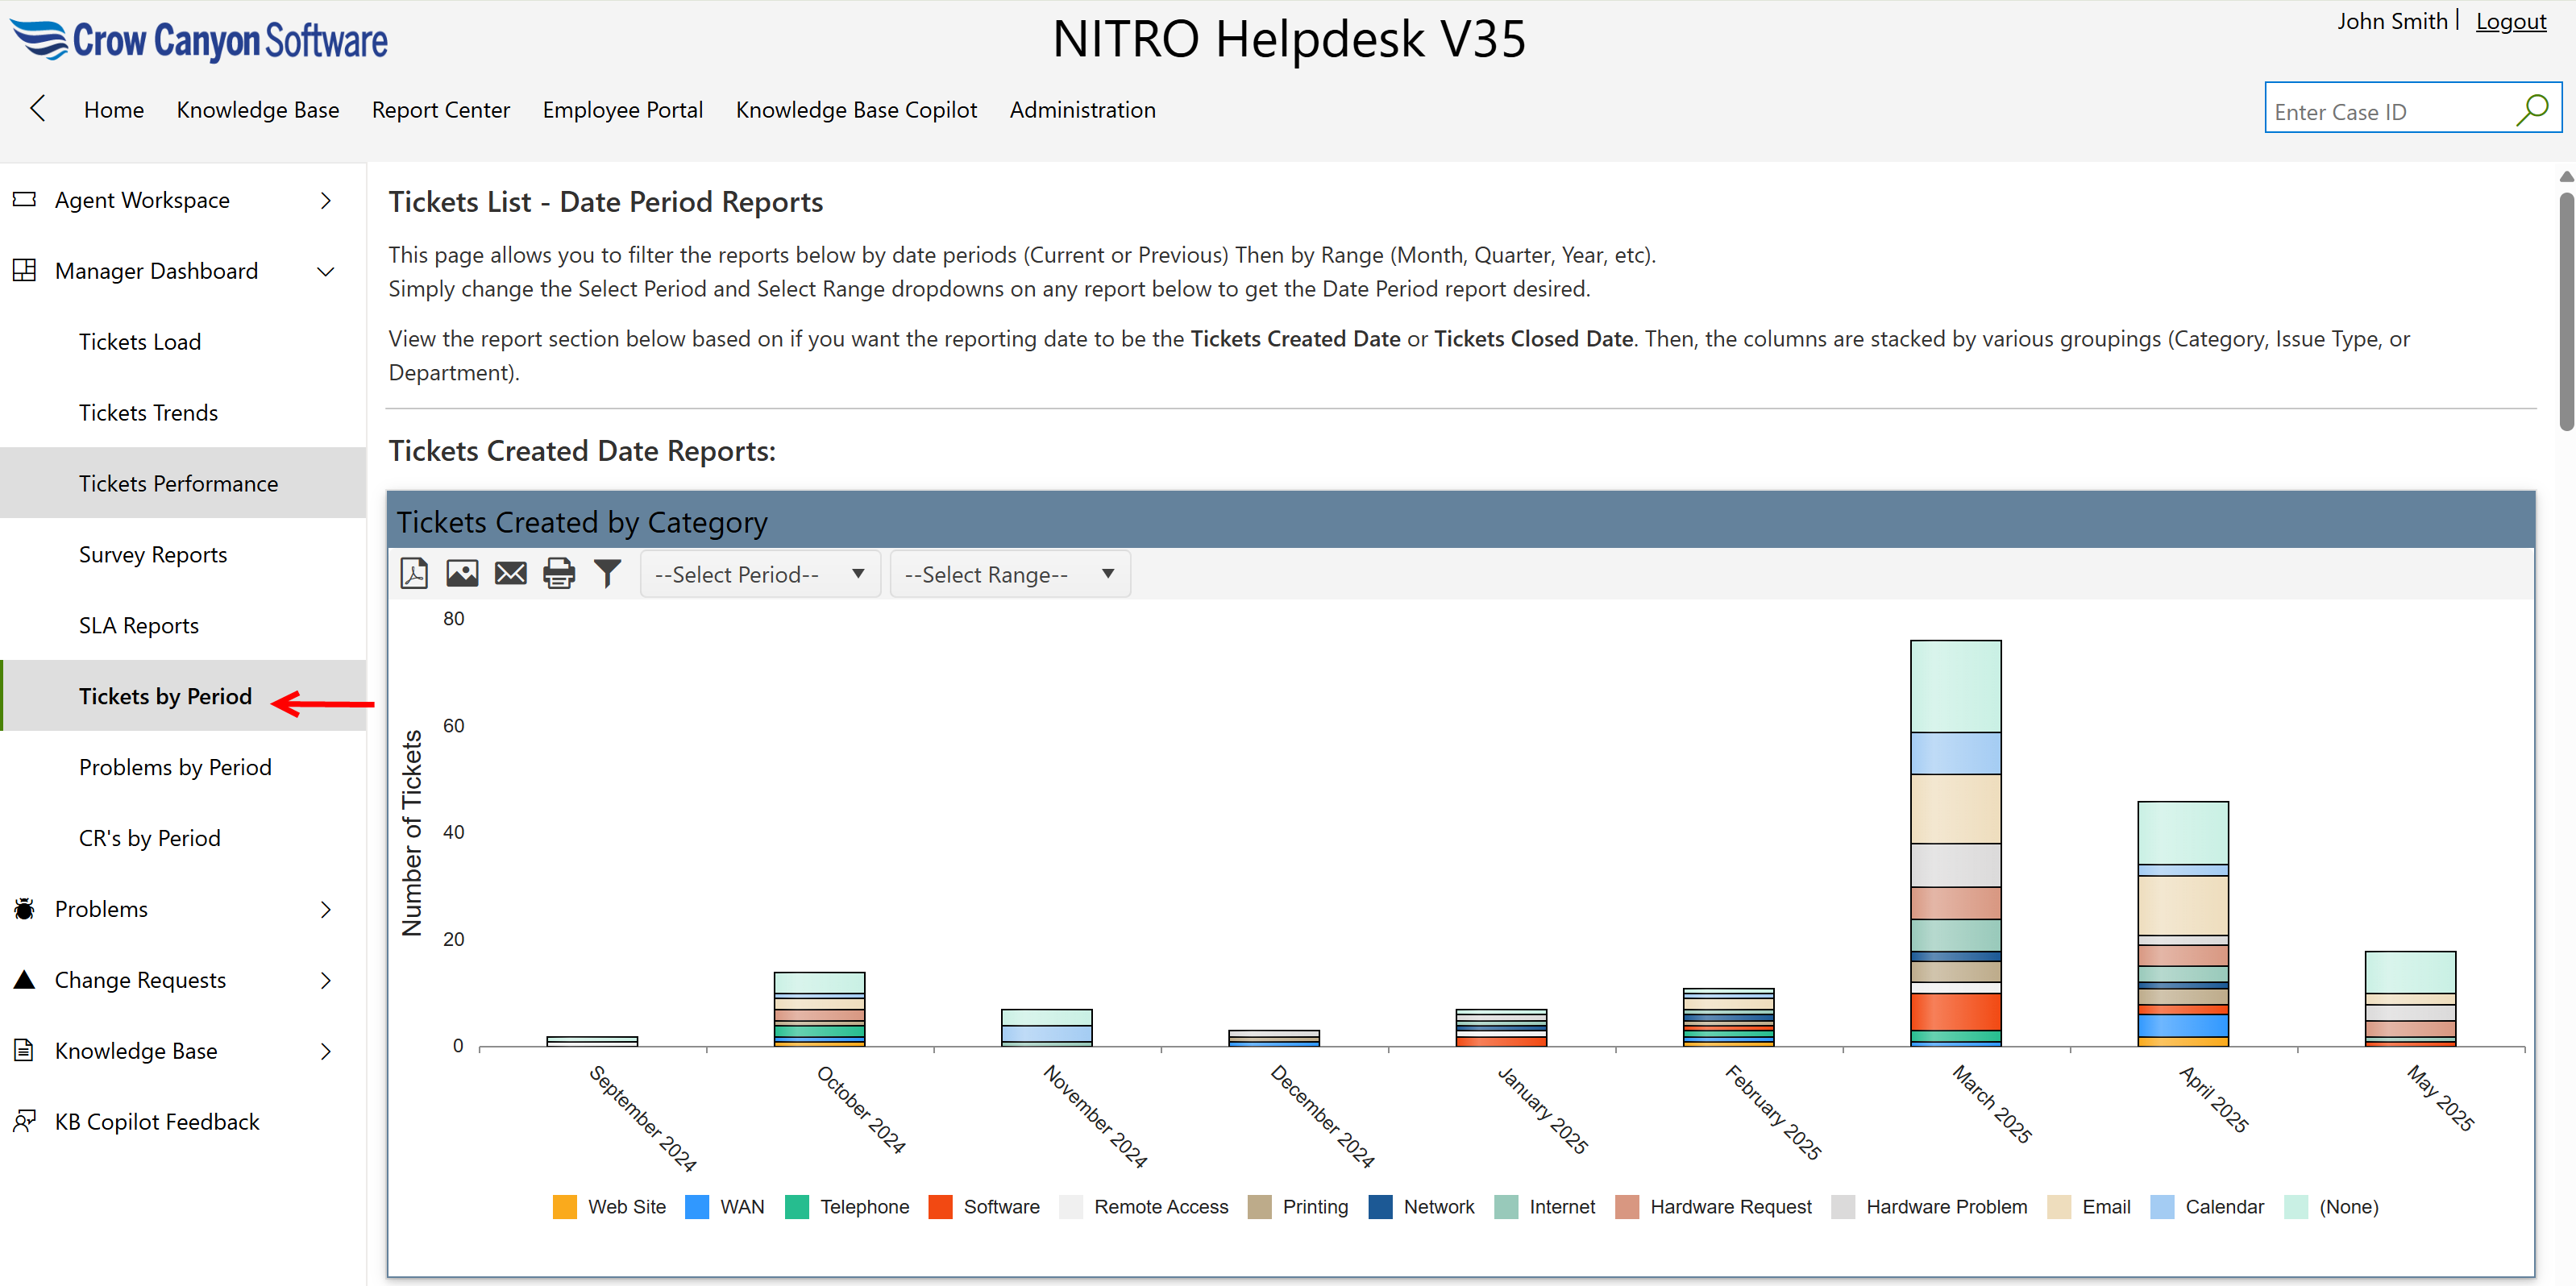
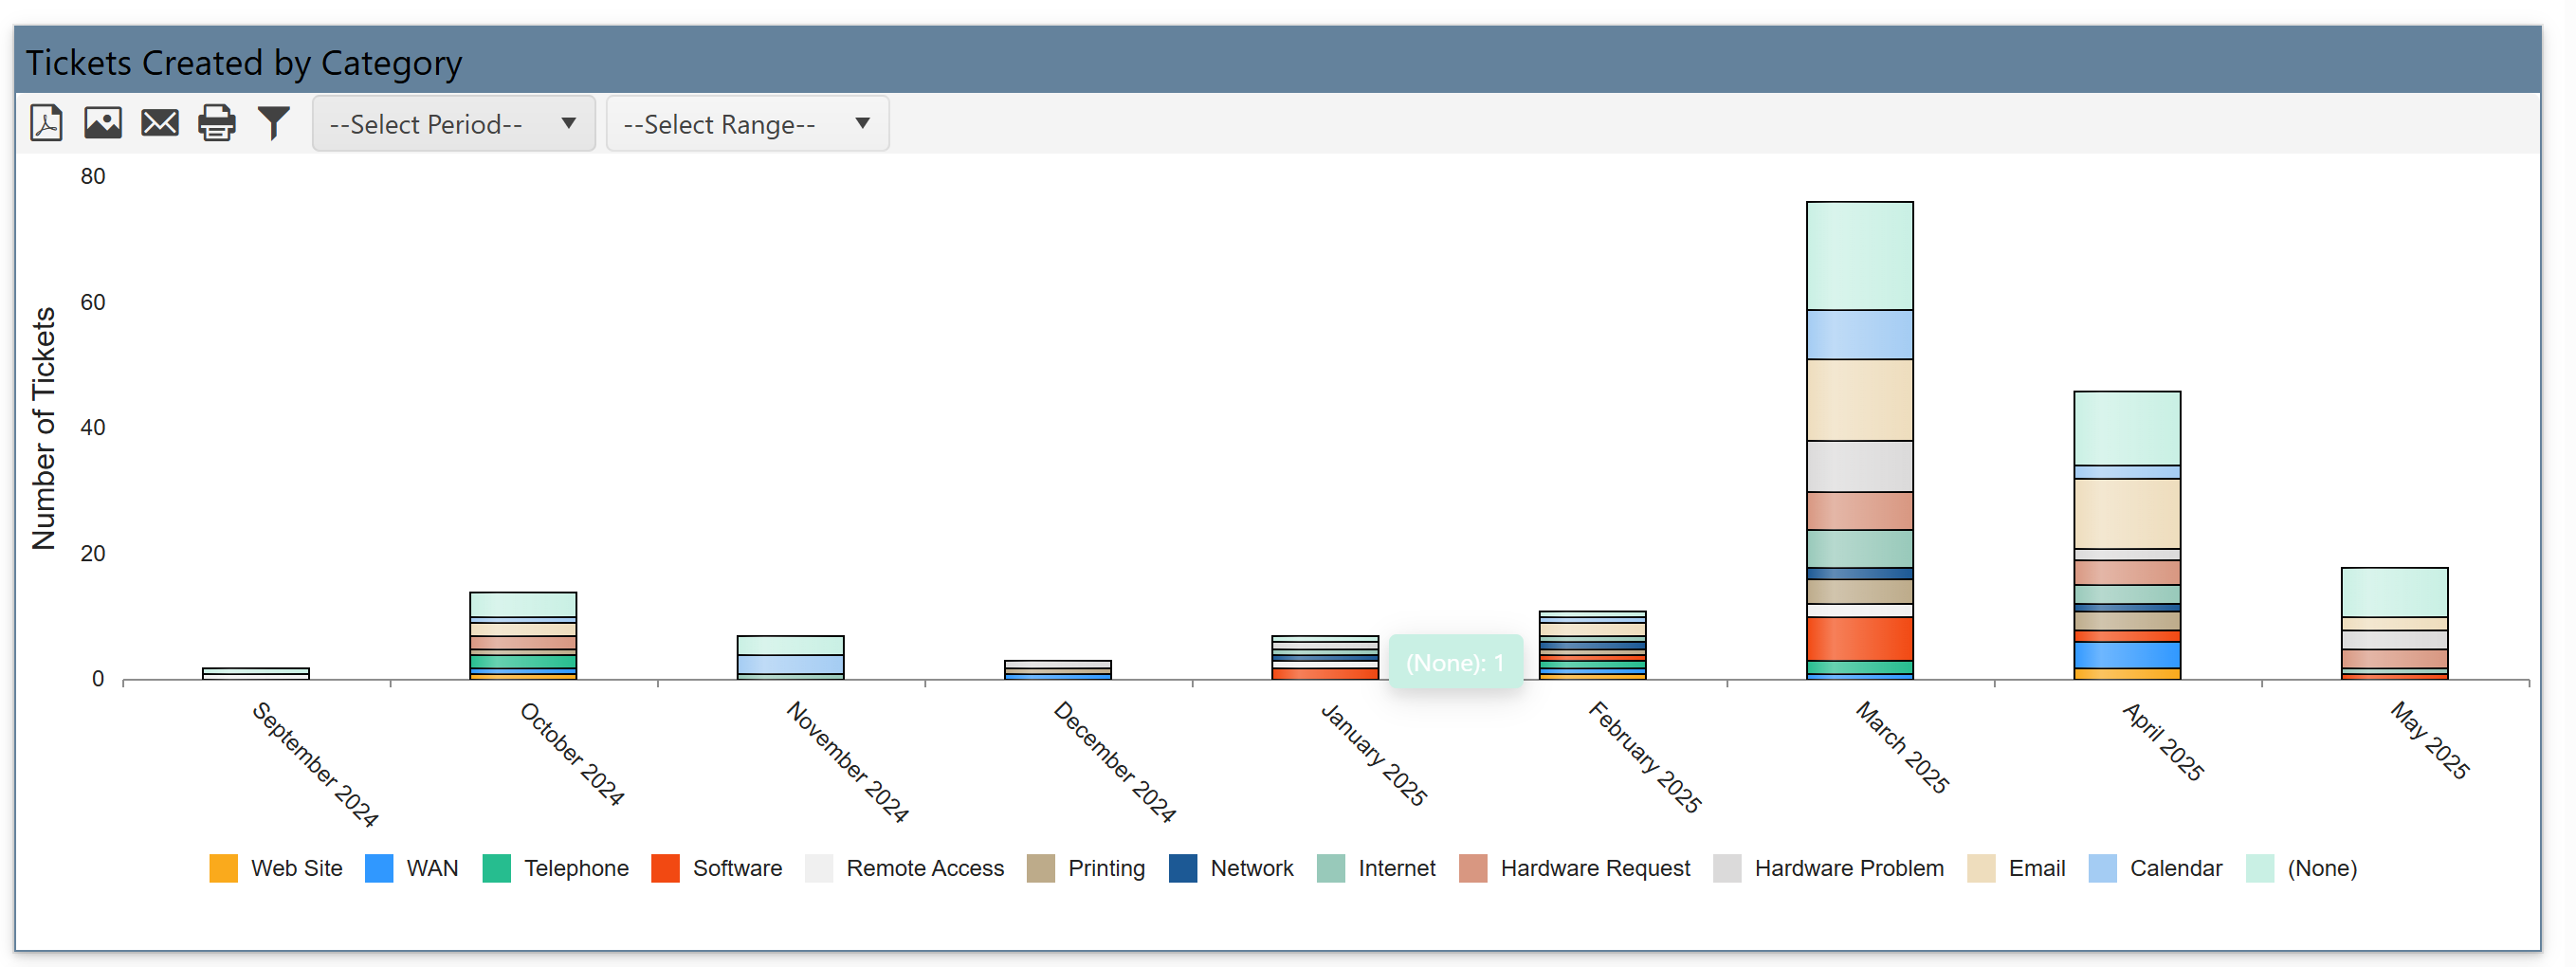
Tickets Created by Category:
This report shows a bar chart with the number of tickets created in each category like Email, Software, Telephone, VPN, Hardware Problem, etc.
It helps understand what types of issues are being reported most often over time.
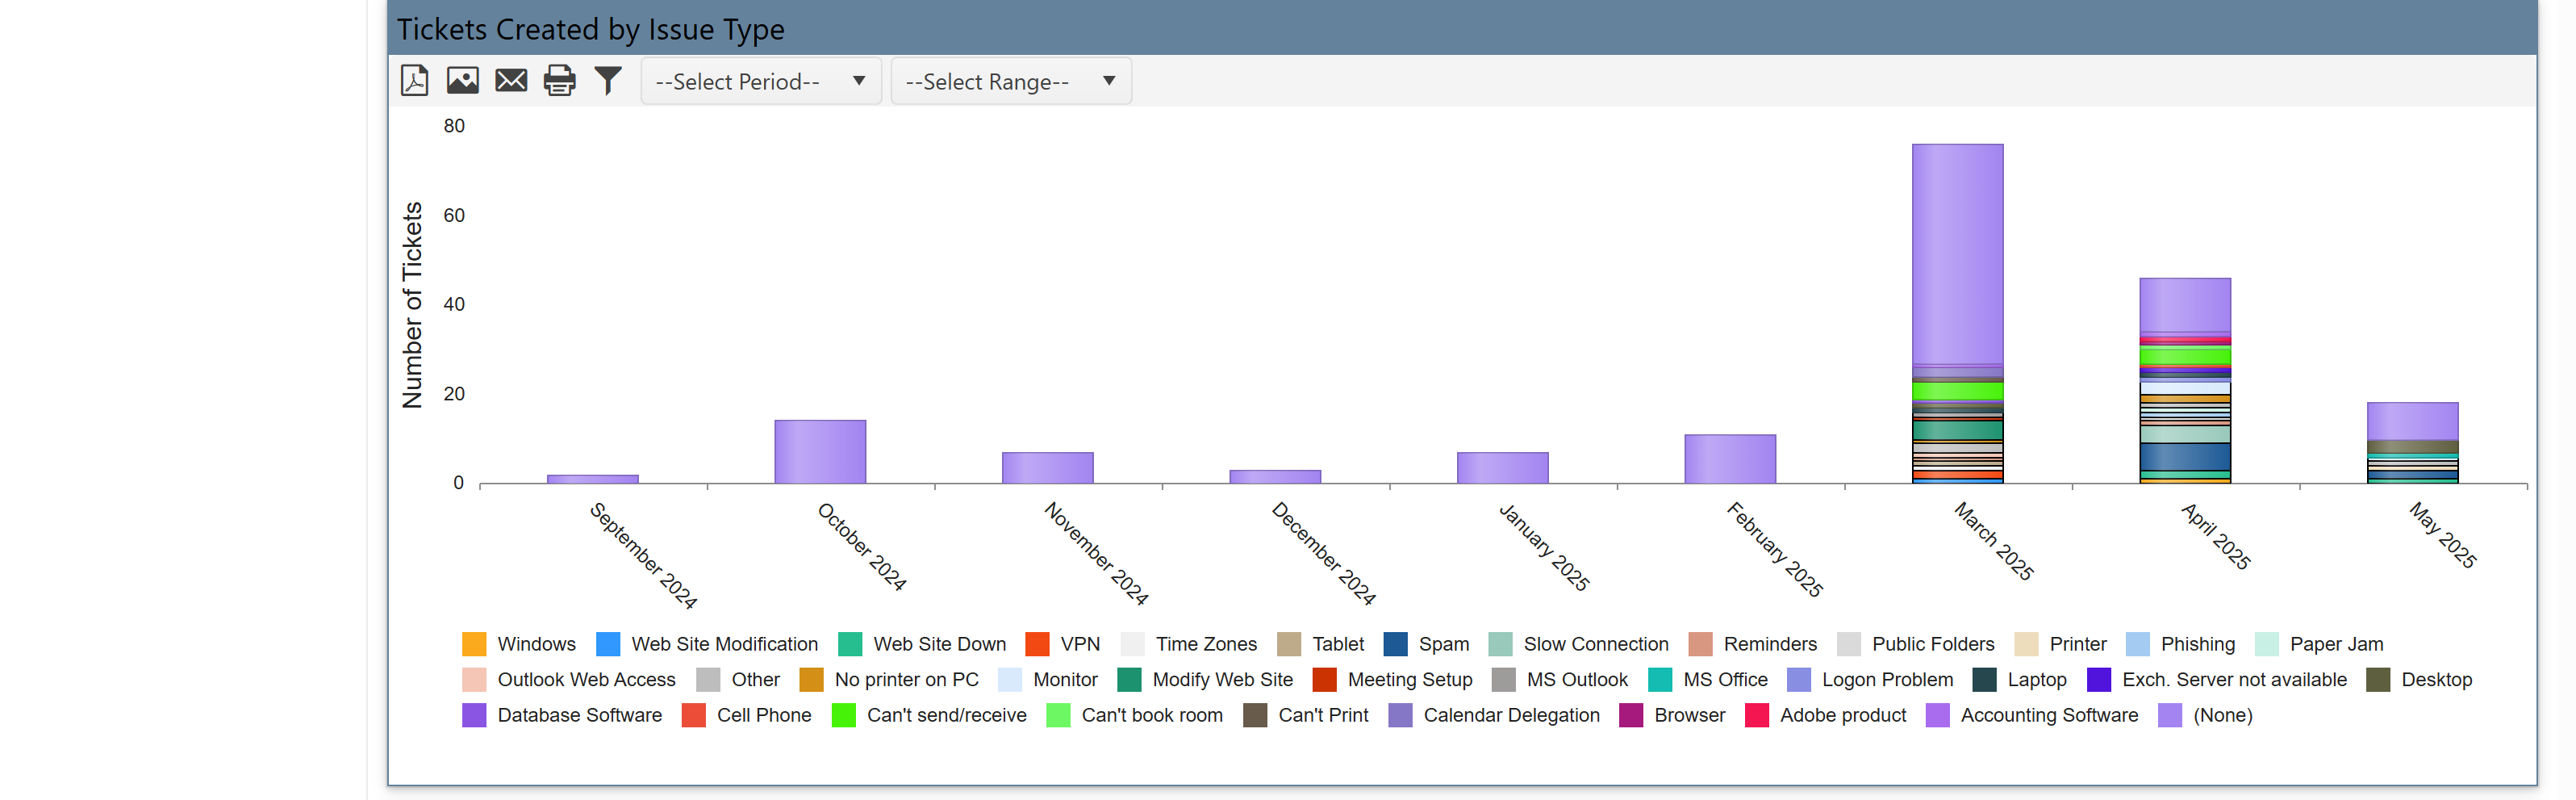
Tickets Created by Issue Type
It shows a more detailed breakdown within categories – for example, under Software, it may show “Outlook Issue”, “Application Crash”, etc.
It lets you pinpoint exactly what problems users are facing most frequently.
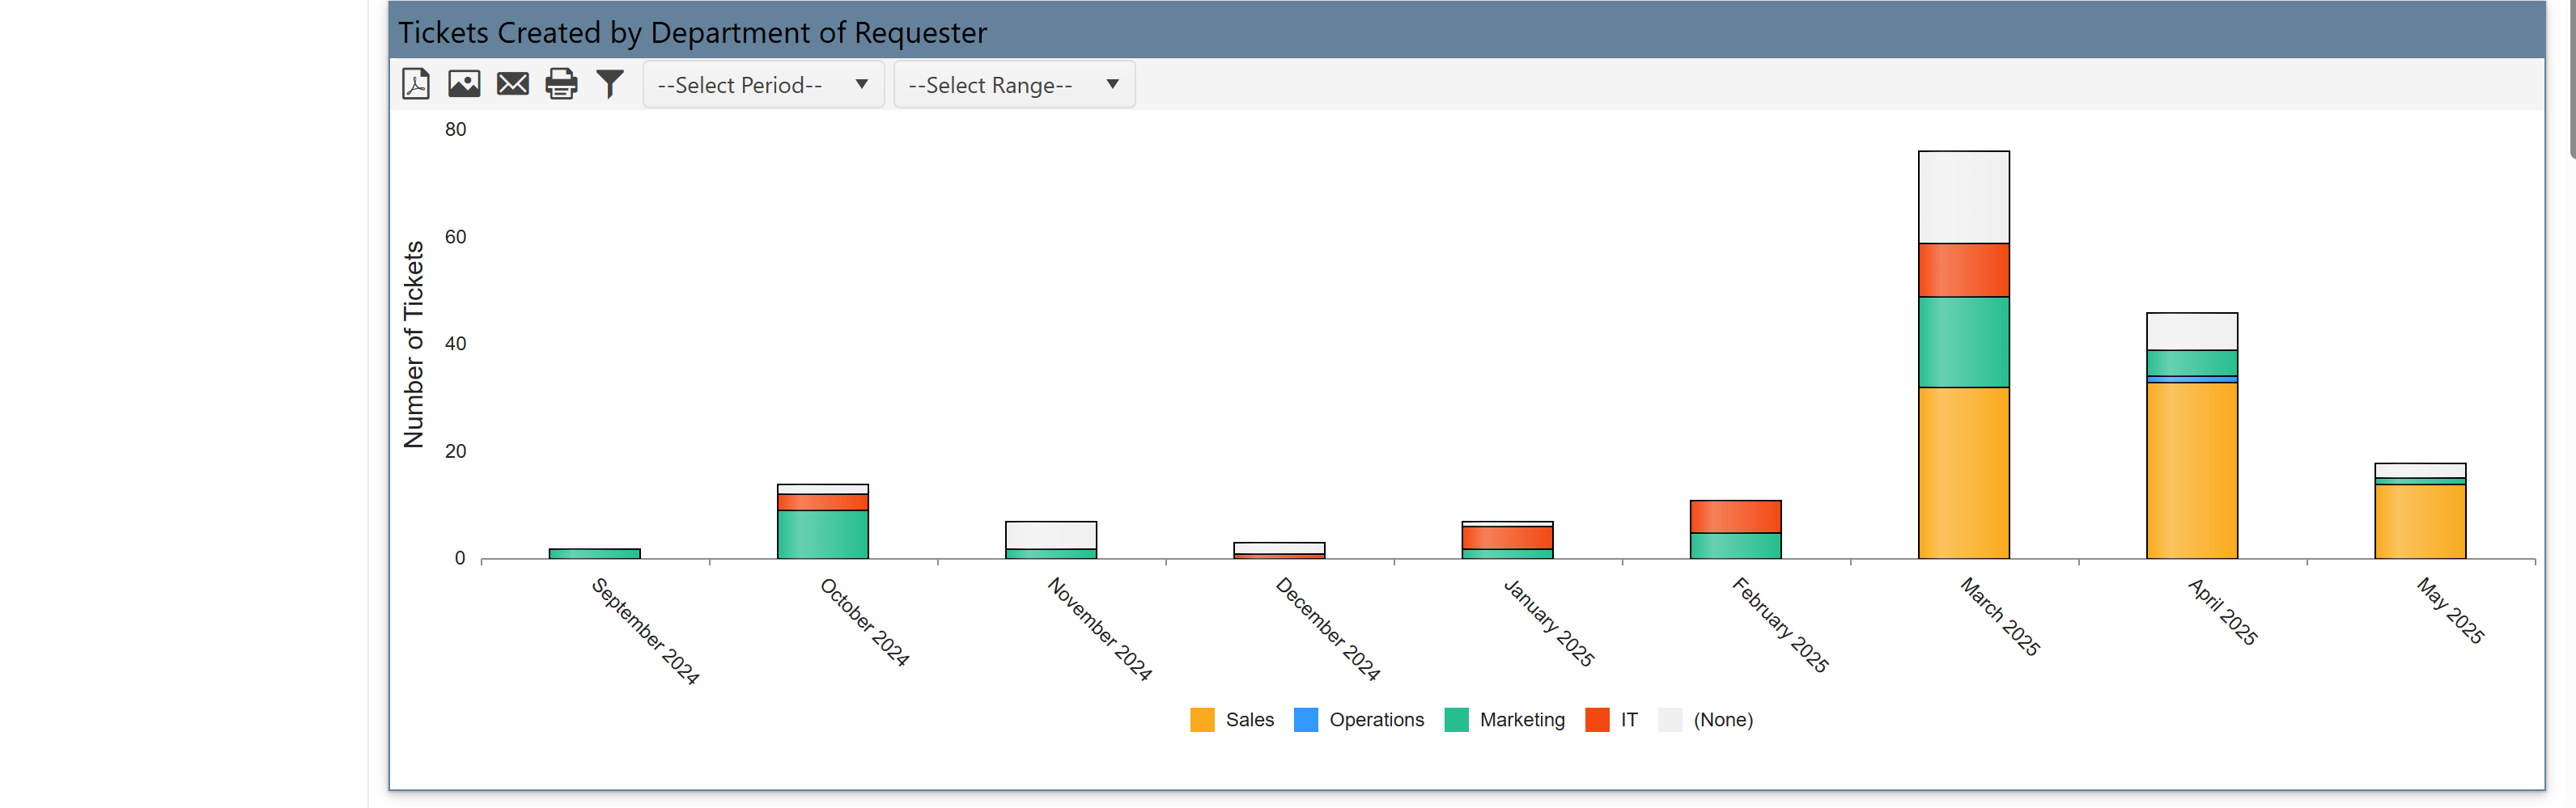
Tickets Created by Department of Requester
It shows groups ticket creation by department (e.g., Sales, Marketing, Operations).
It shows which departments are raising the most tickets, helping you allocate IT resources accordingly.
Tickets Closed Date Reports
These reports show how many tickets were closed (i.e., resolved), grouped similarly to the created reports:
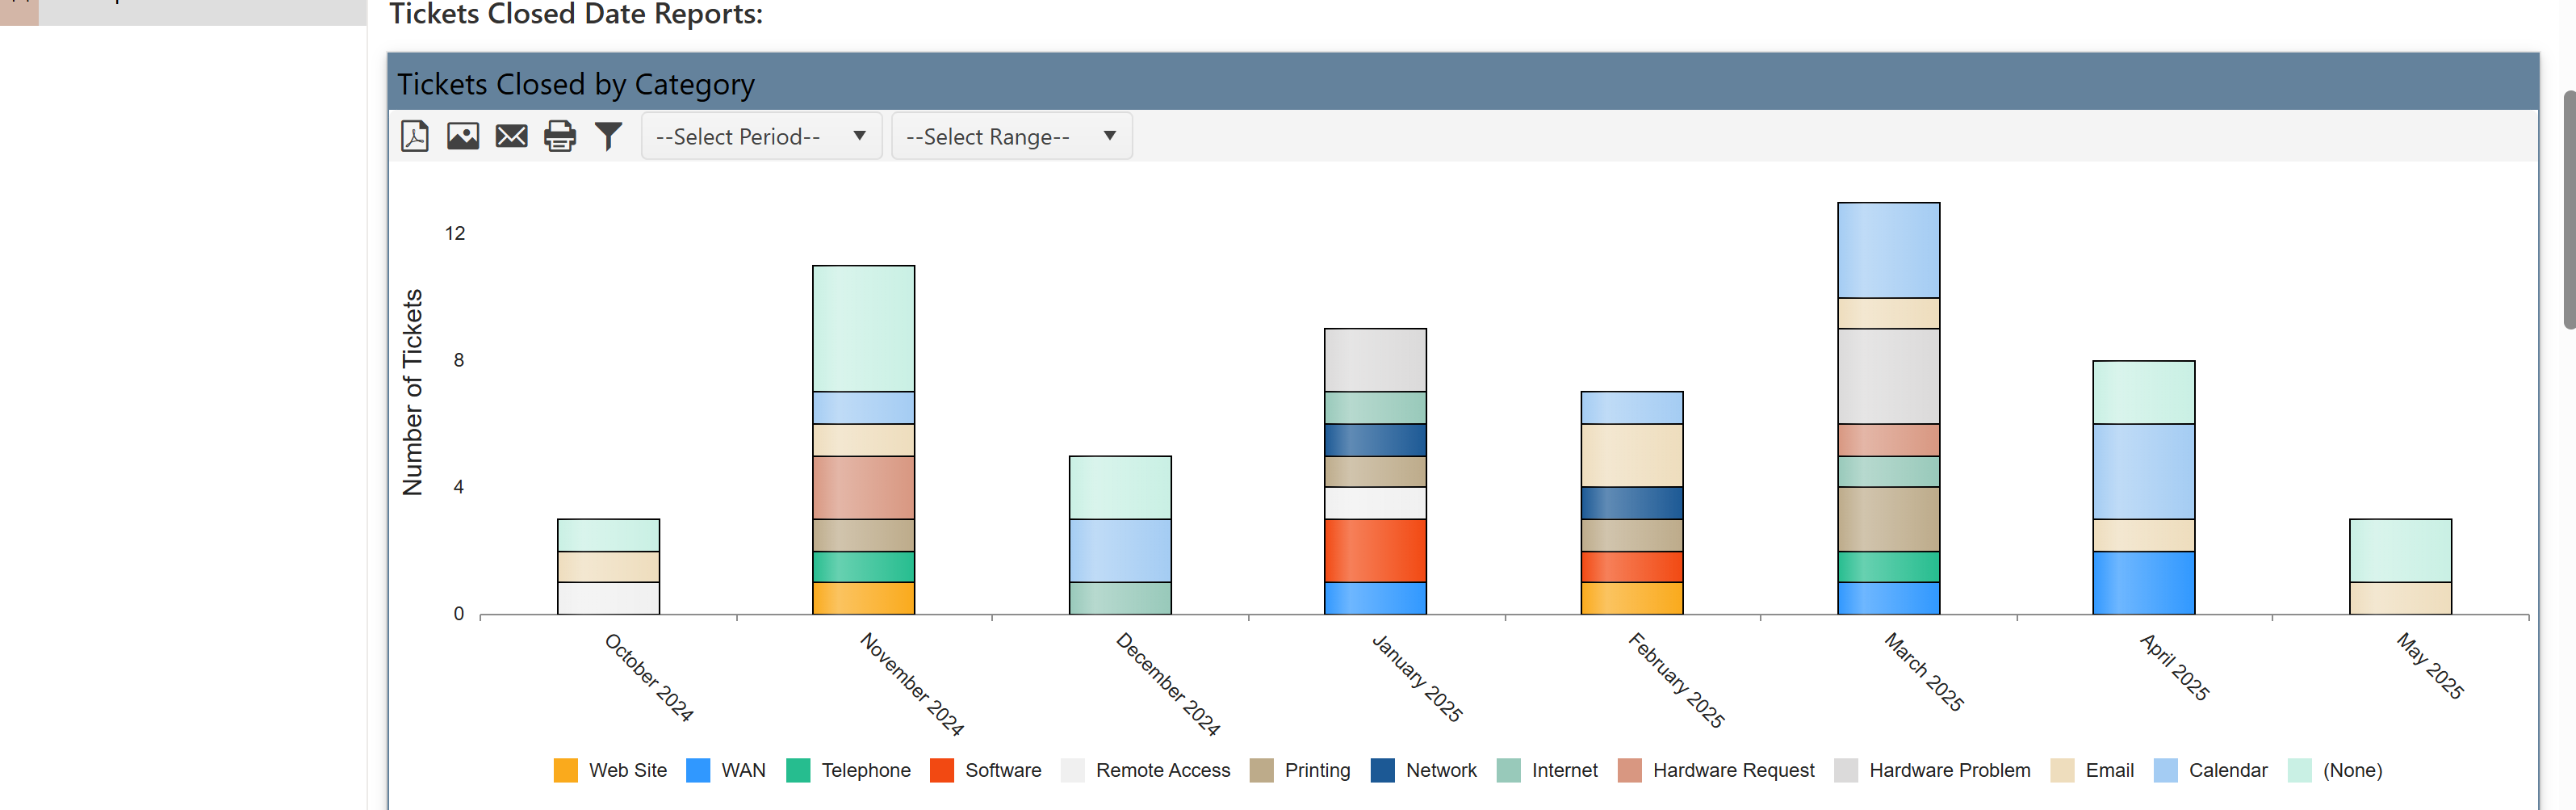
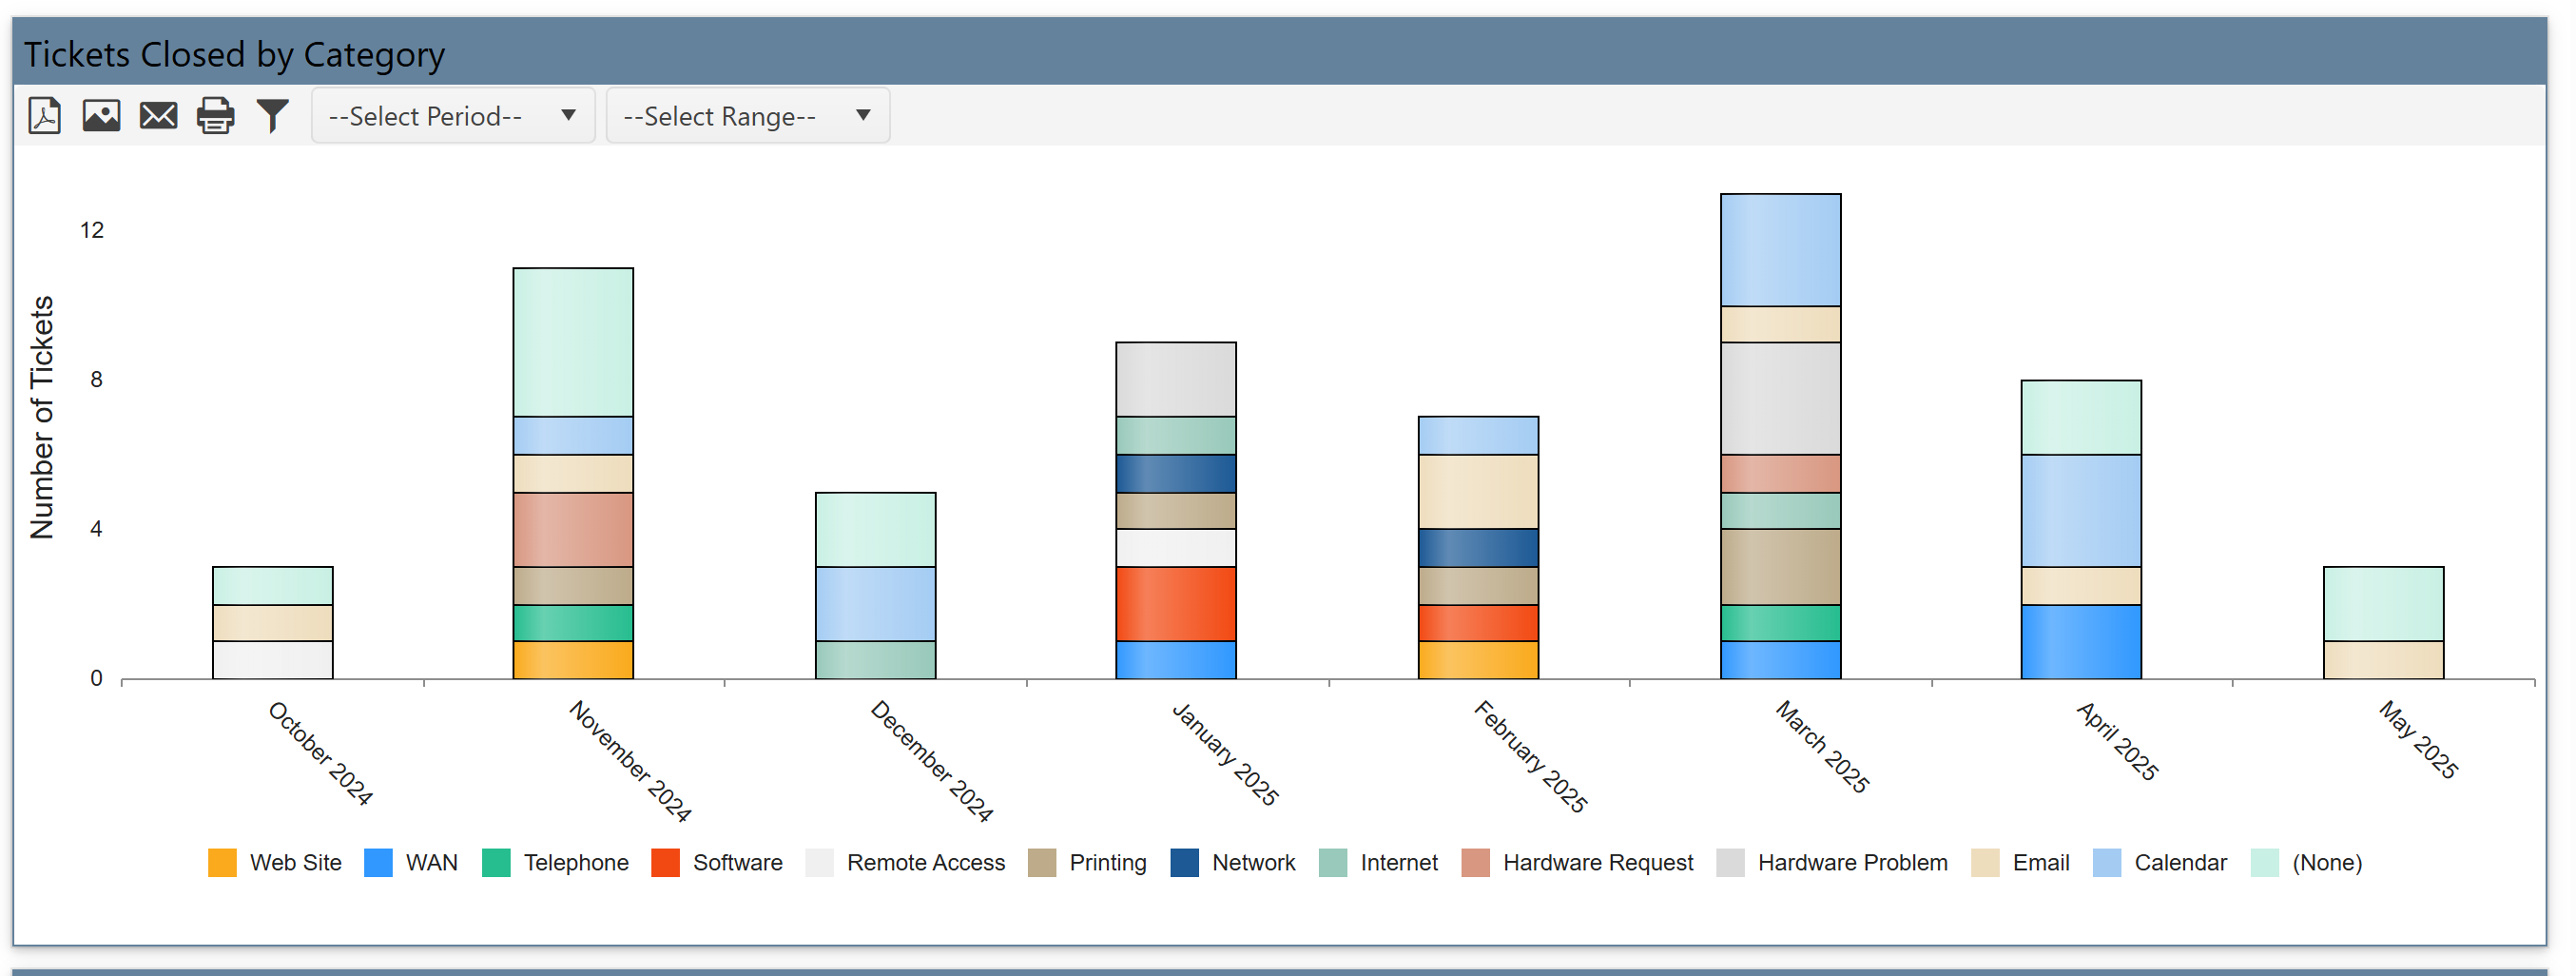
Tickets Closed by Category
It shows number of tickets resolved in each category.
It helps compare against ticket creation to track resolution performance.
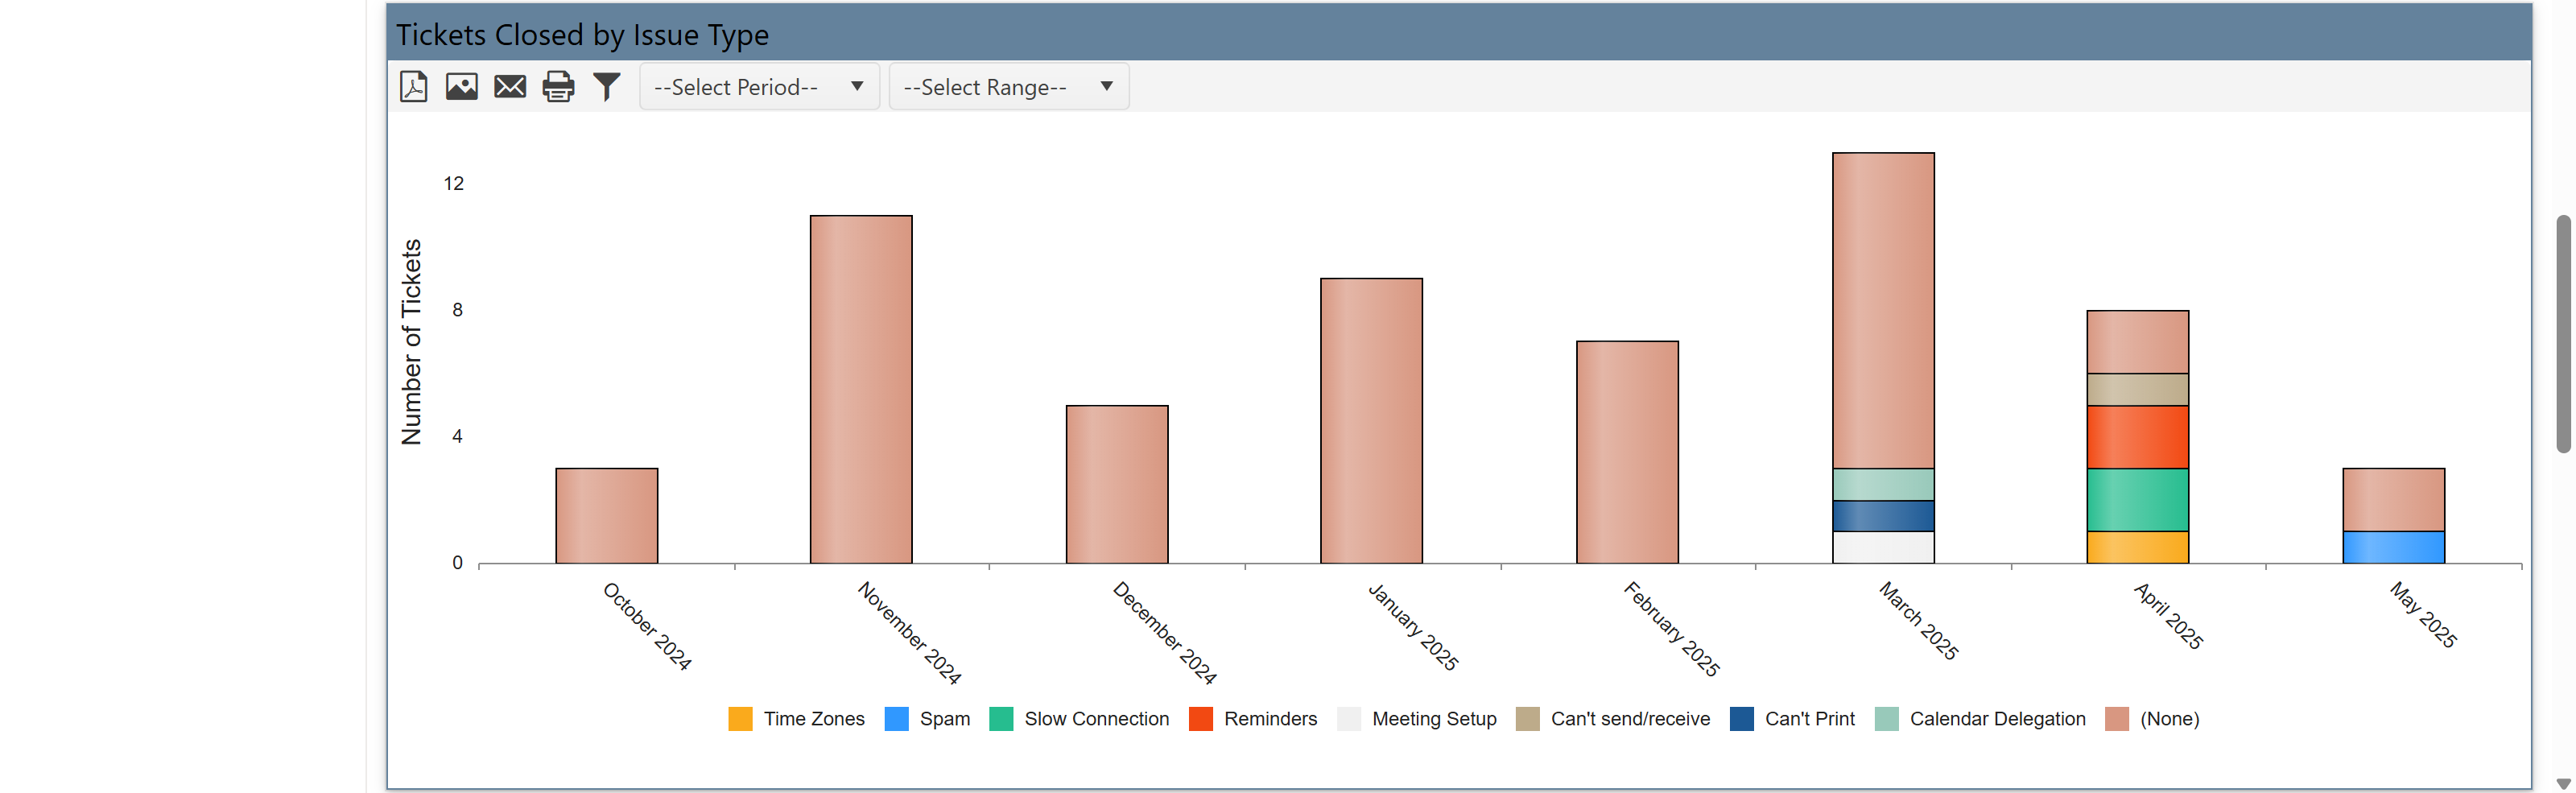
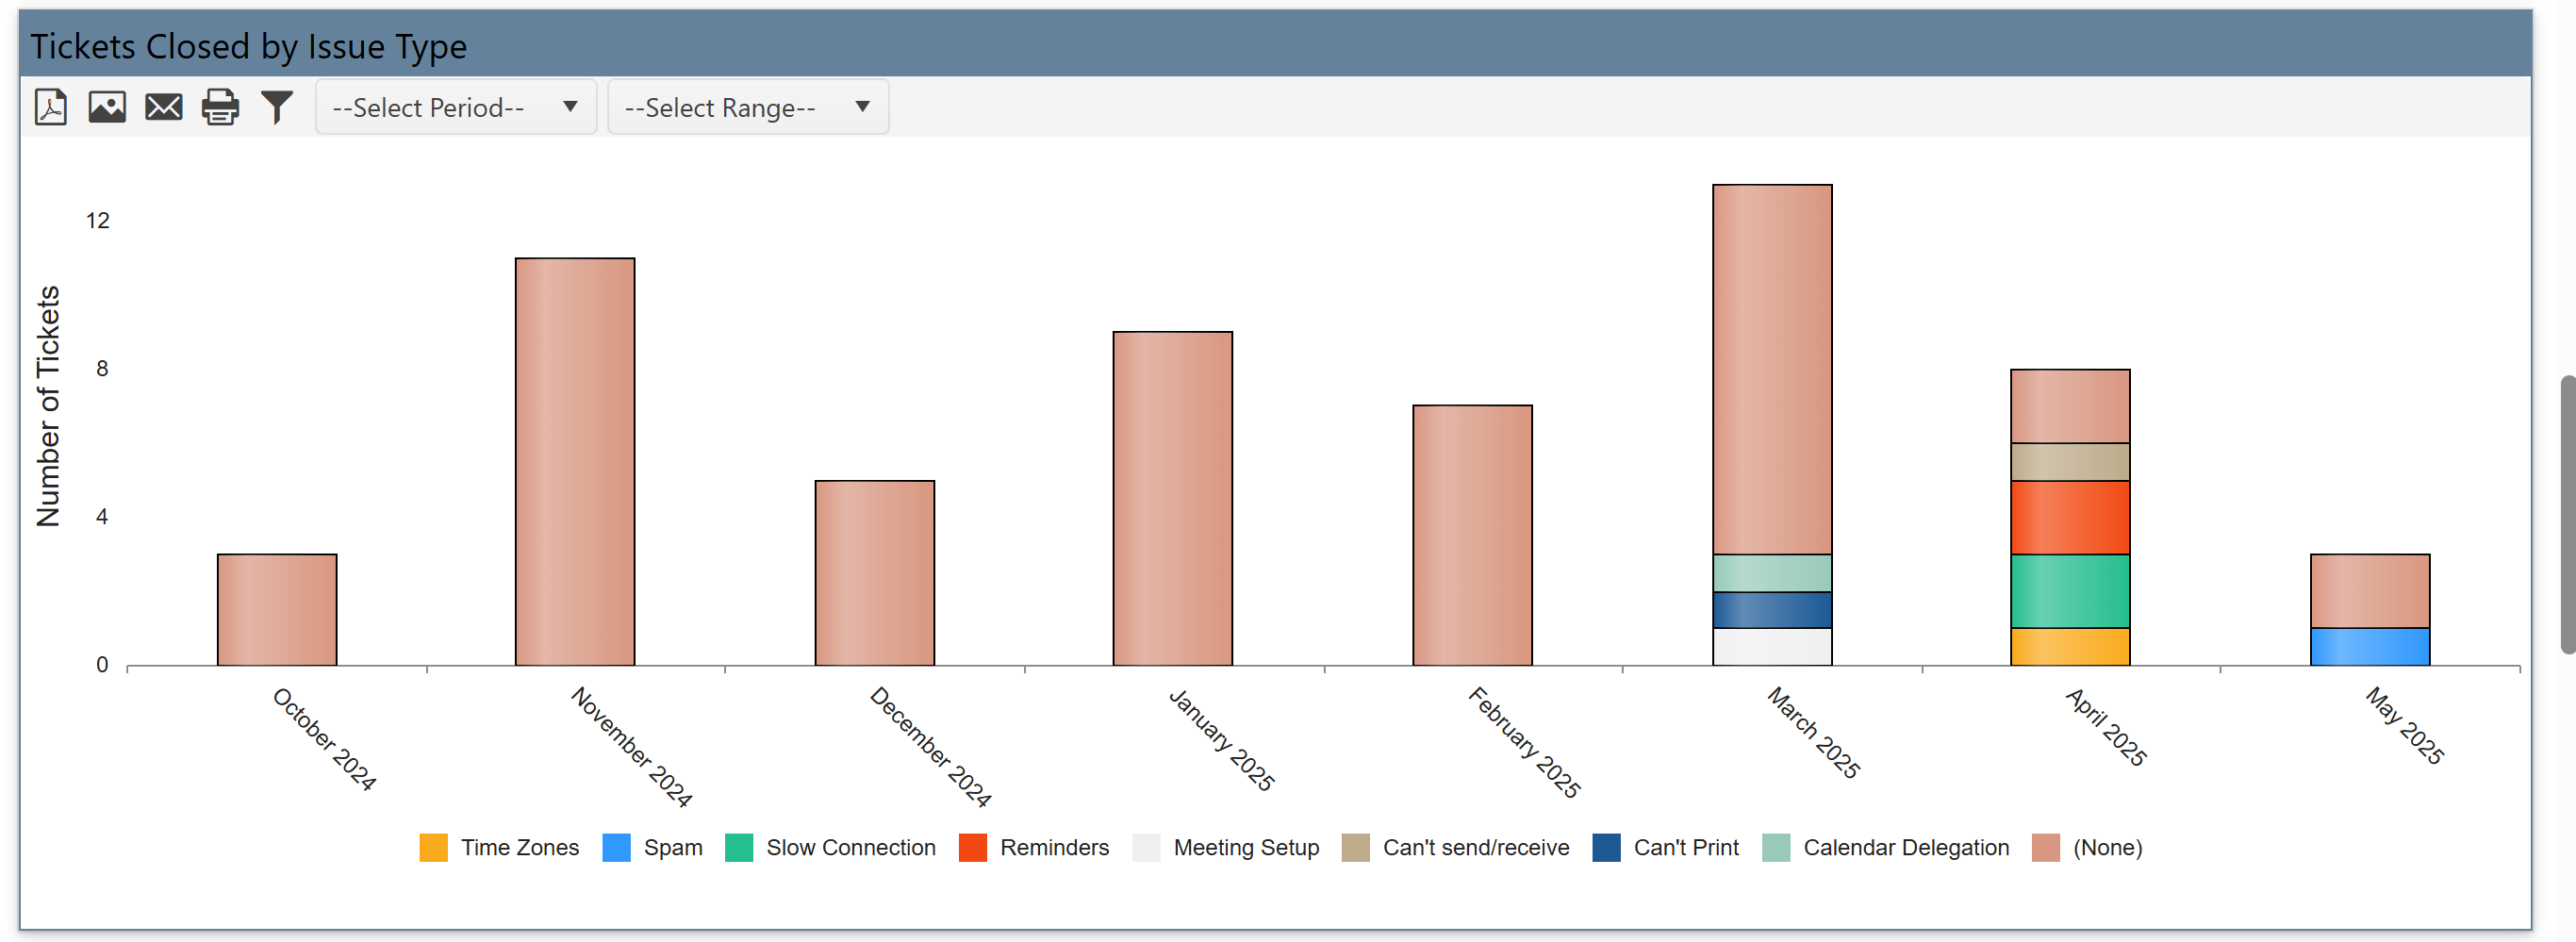
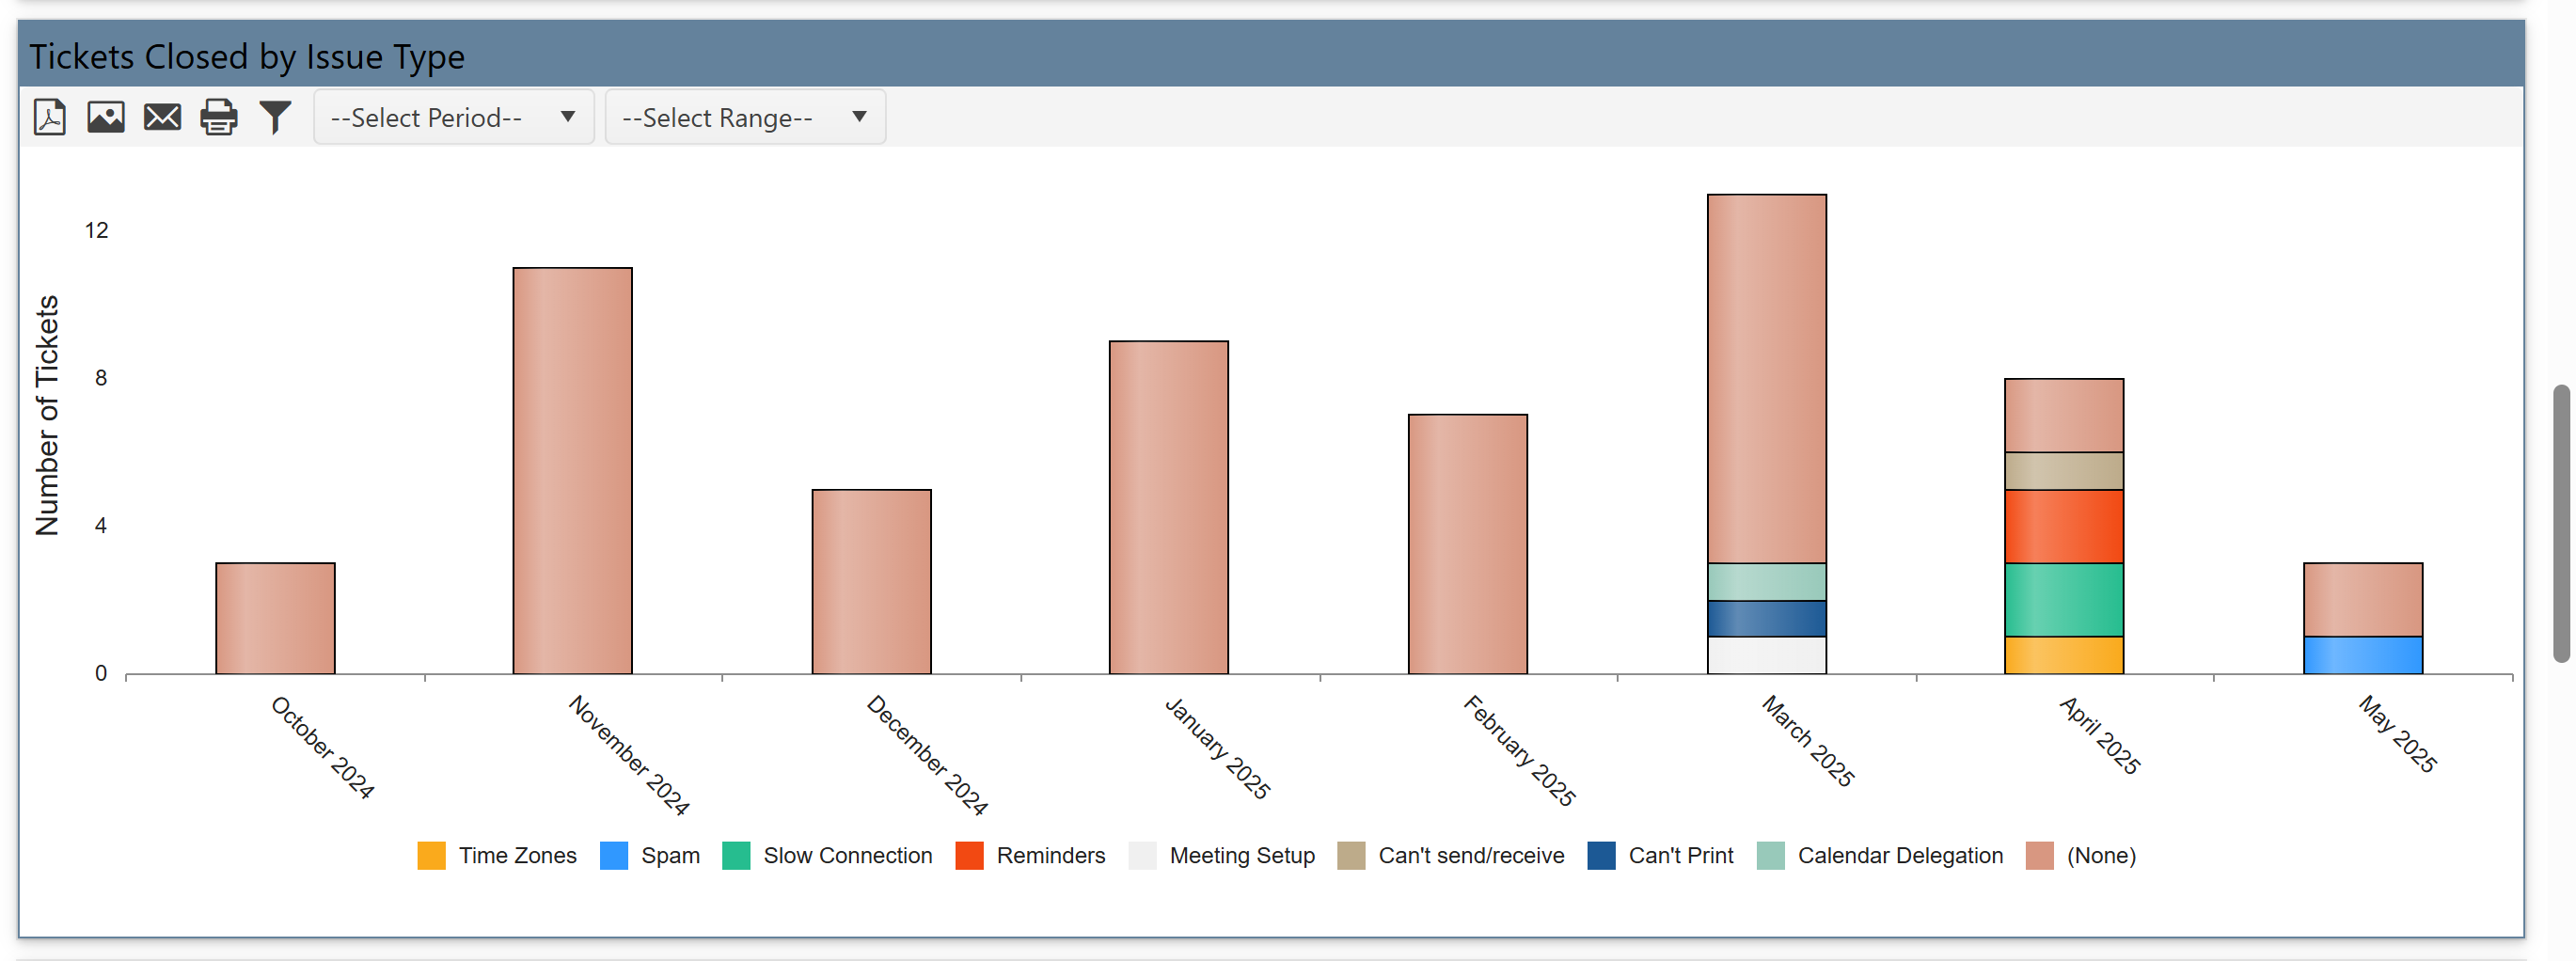
Tickets Closed by Issue Type
It shows Closed tickets for specific issues (e.g., Time Zone Change, Meeting Setup).
It allows analysis of which issues are getting solved and how often.
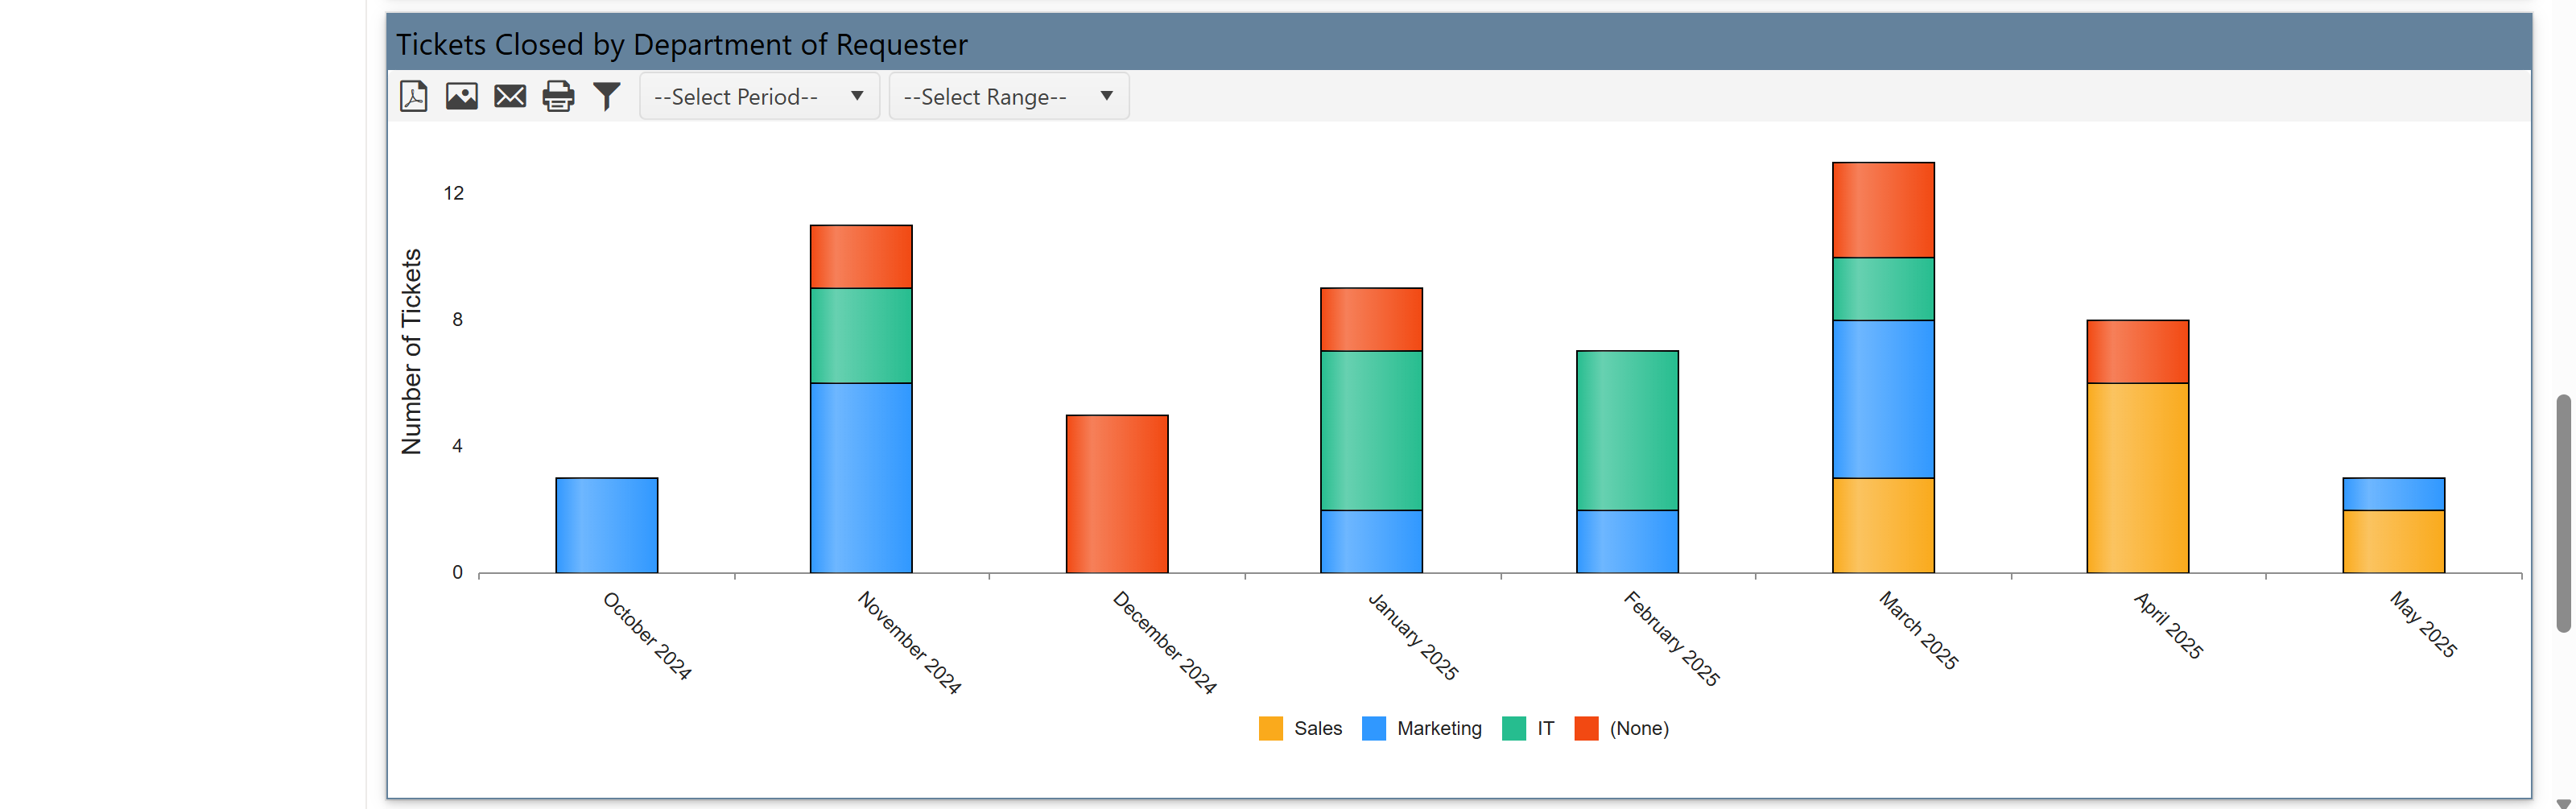
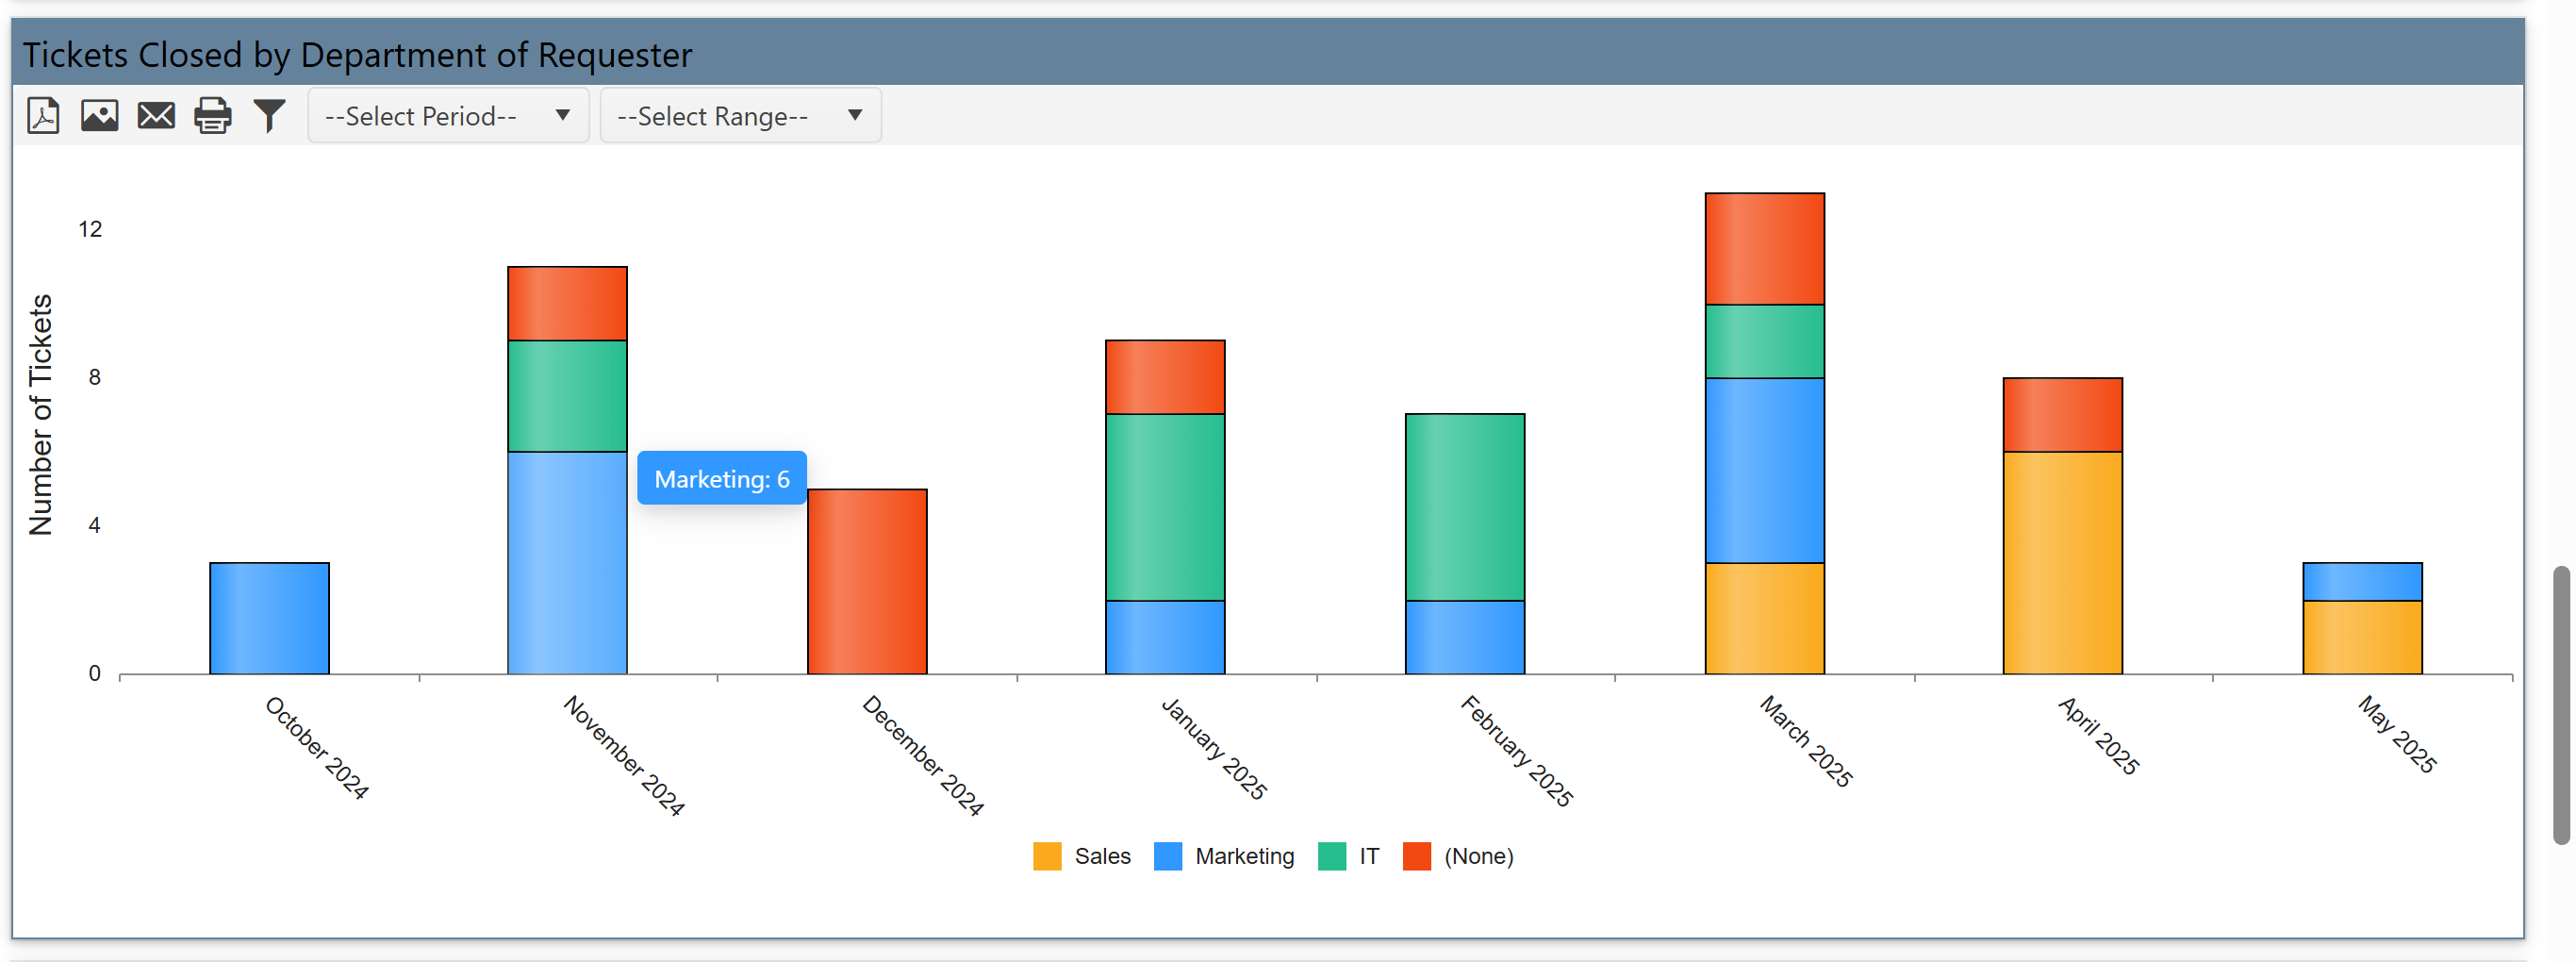
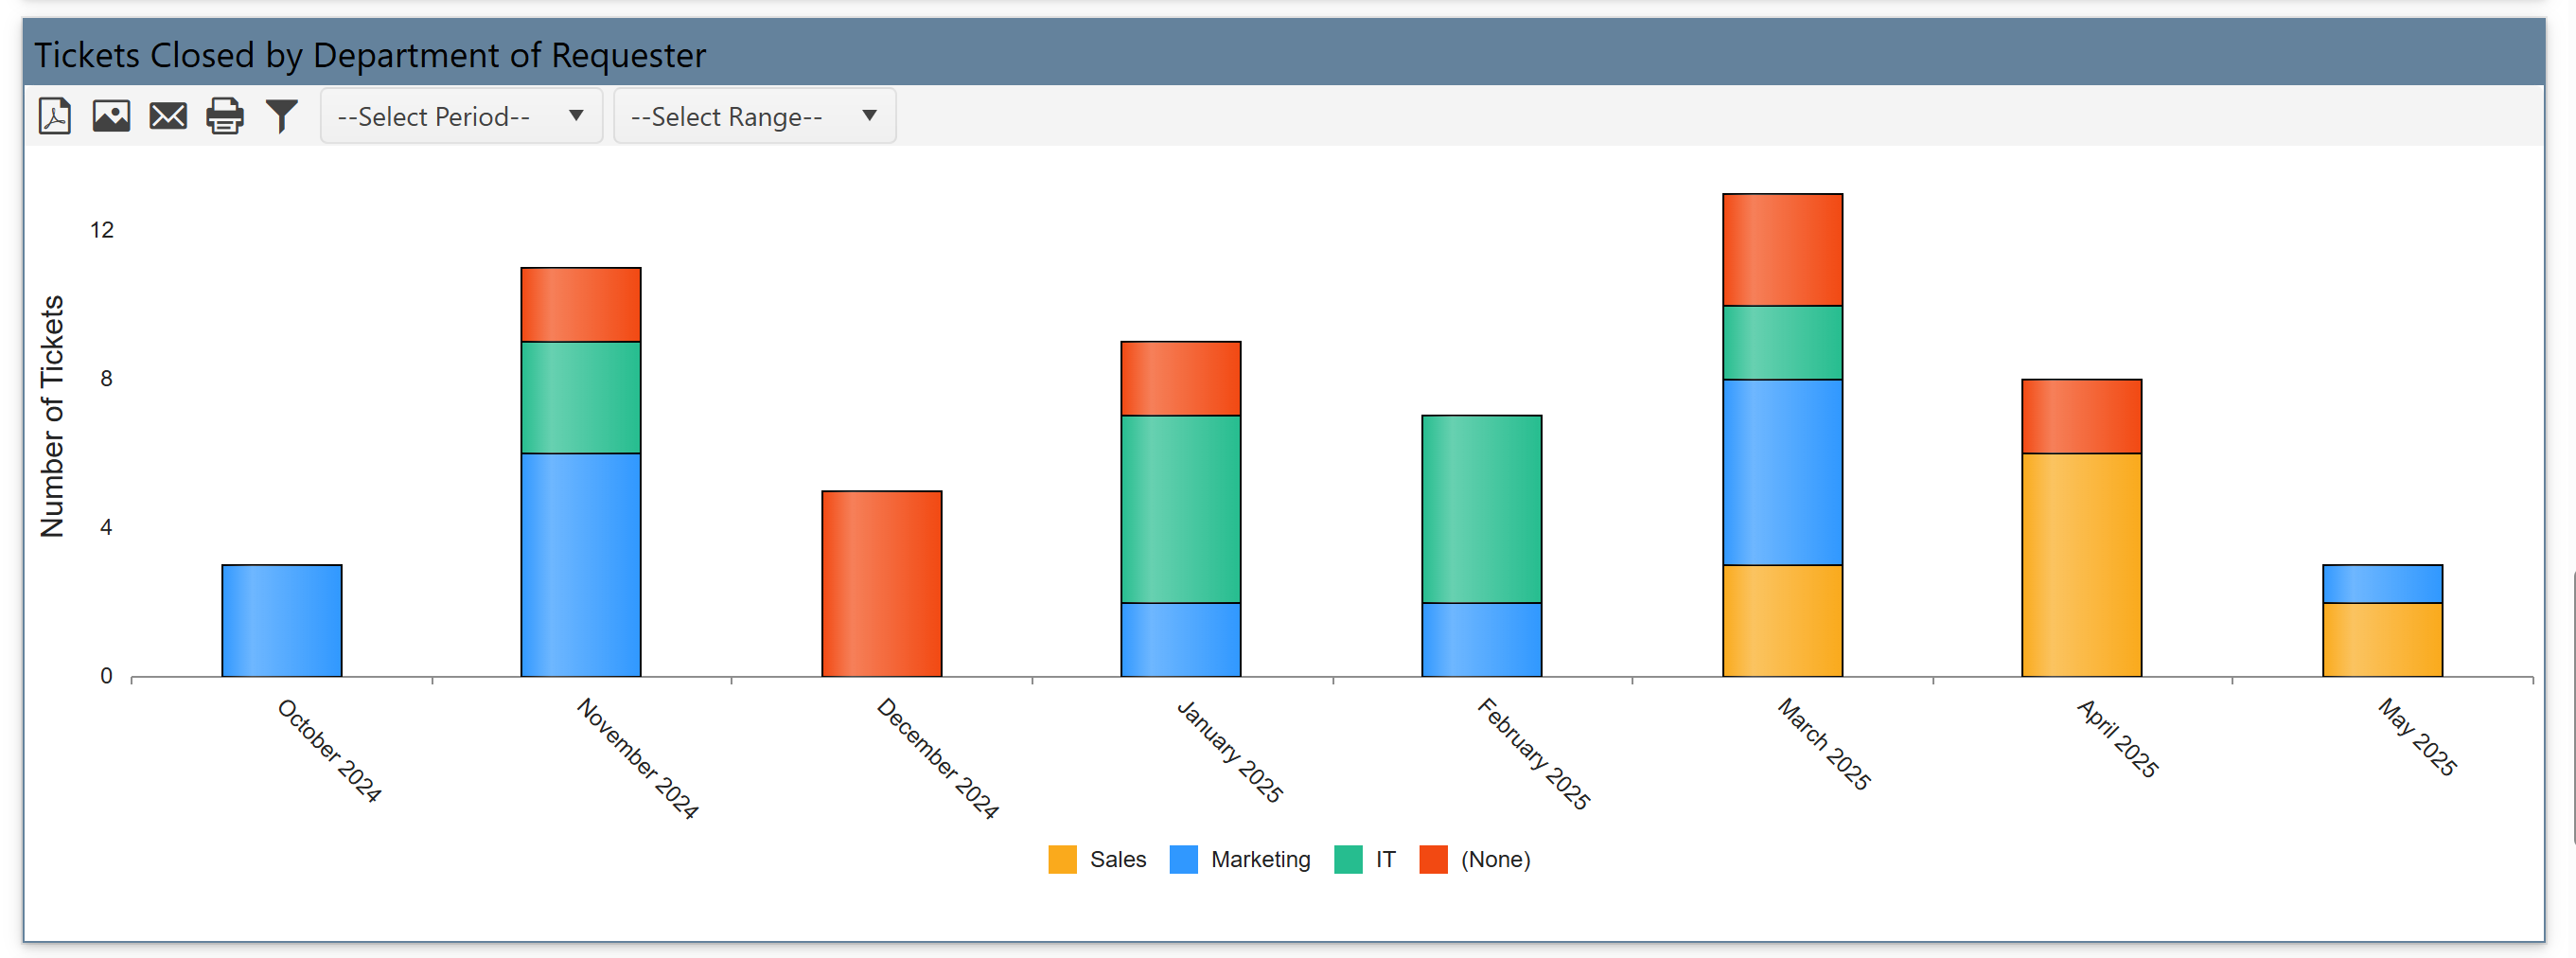
Tickets Closed by Department of Requester
It shows Tickets closed for each requesting department.
It tracks how well IT is serving each department's needs.
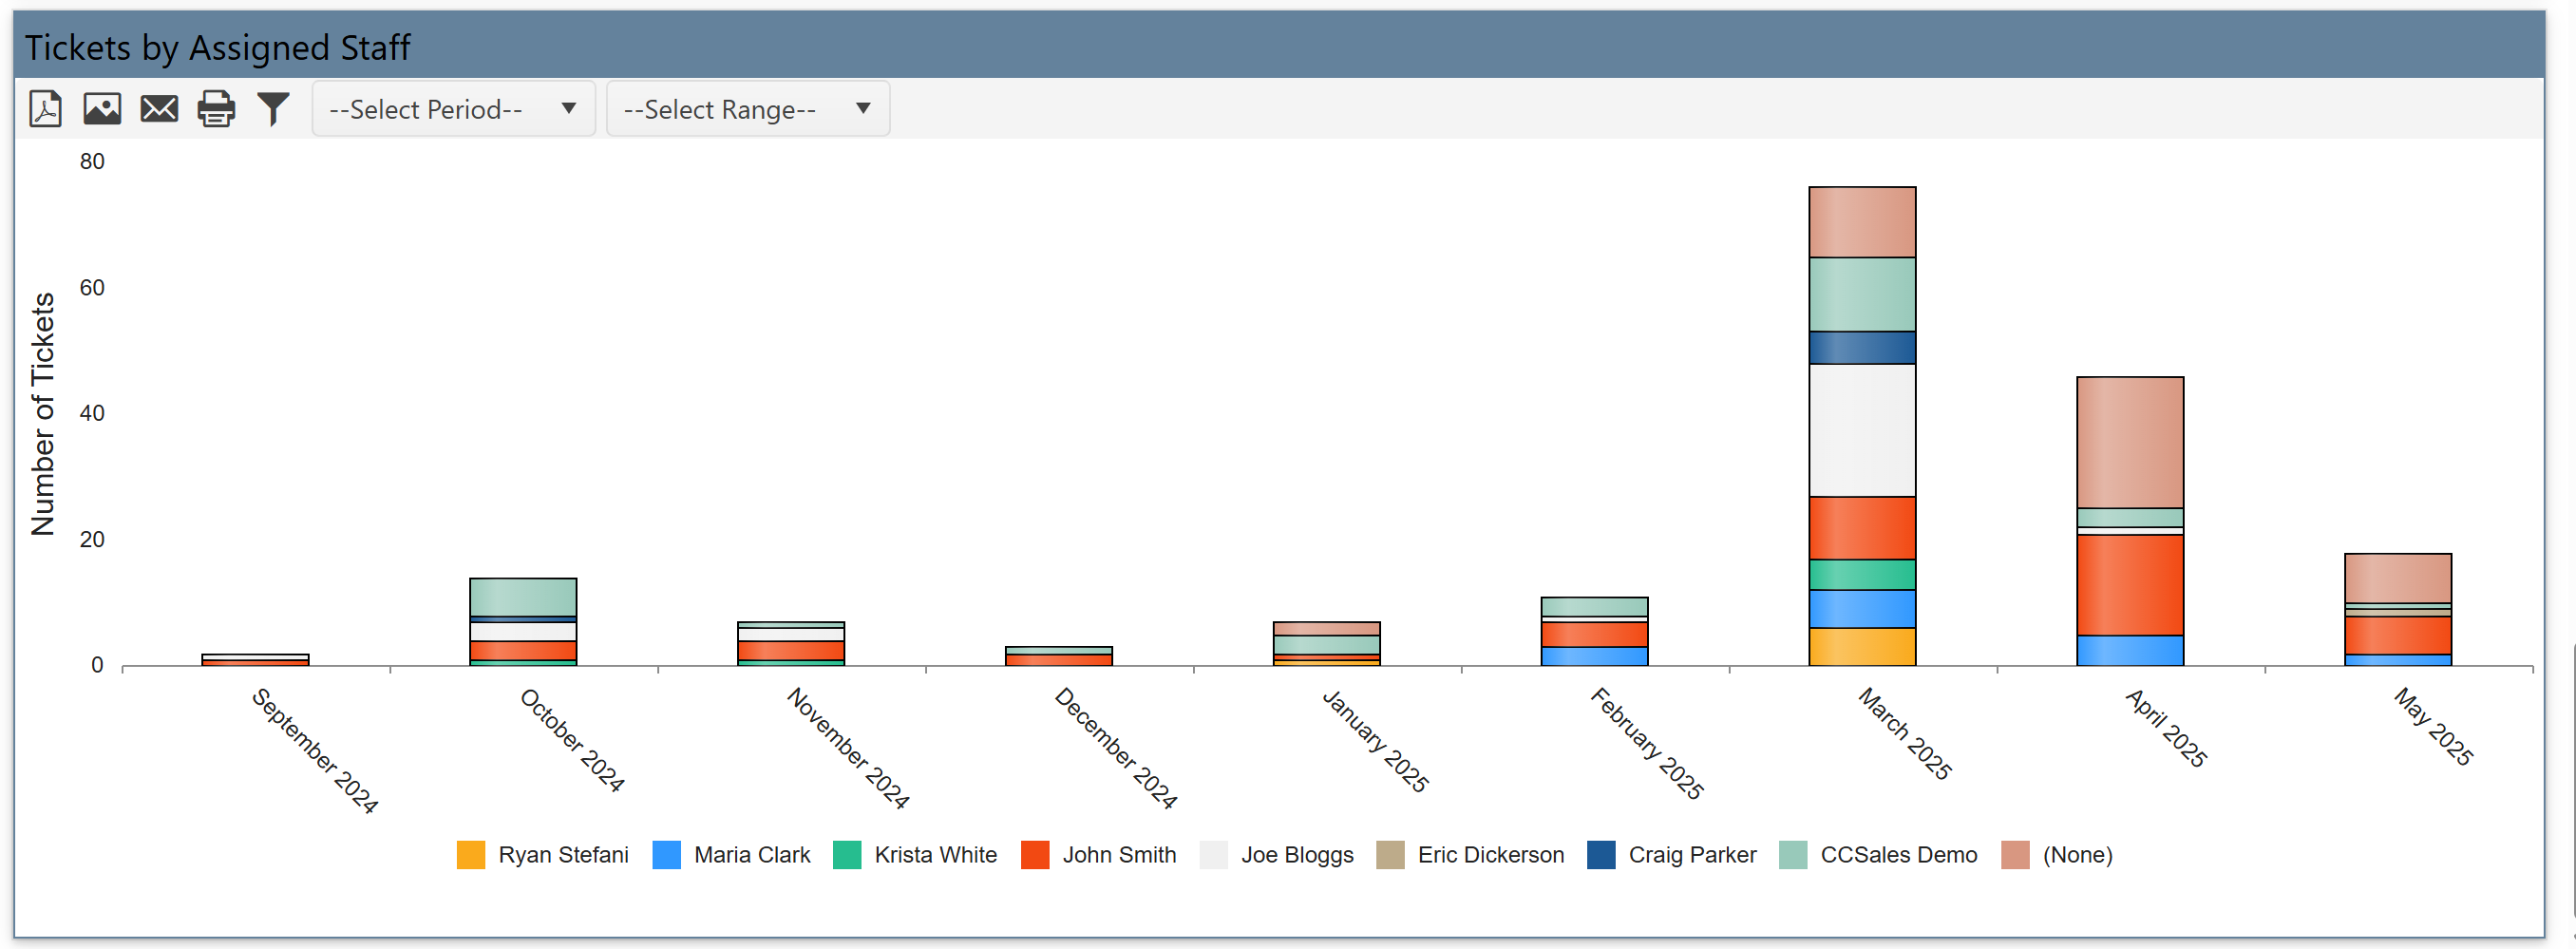
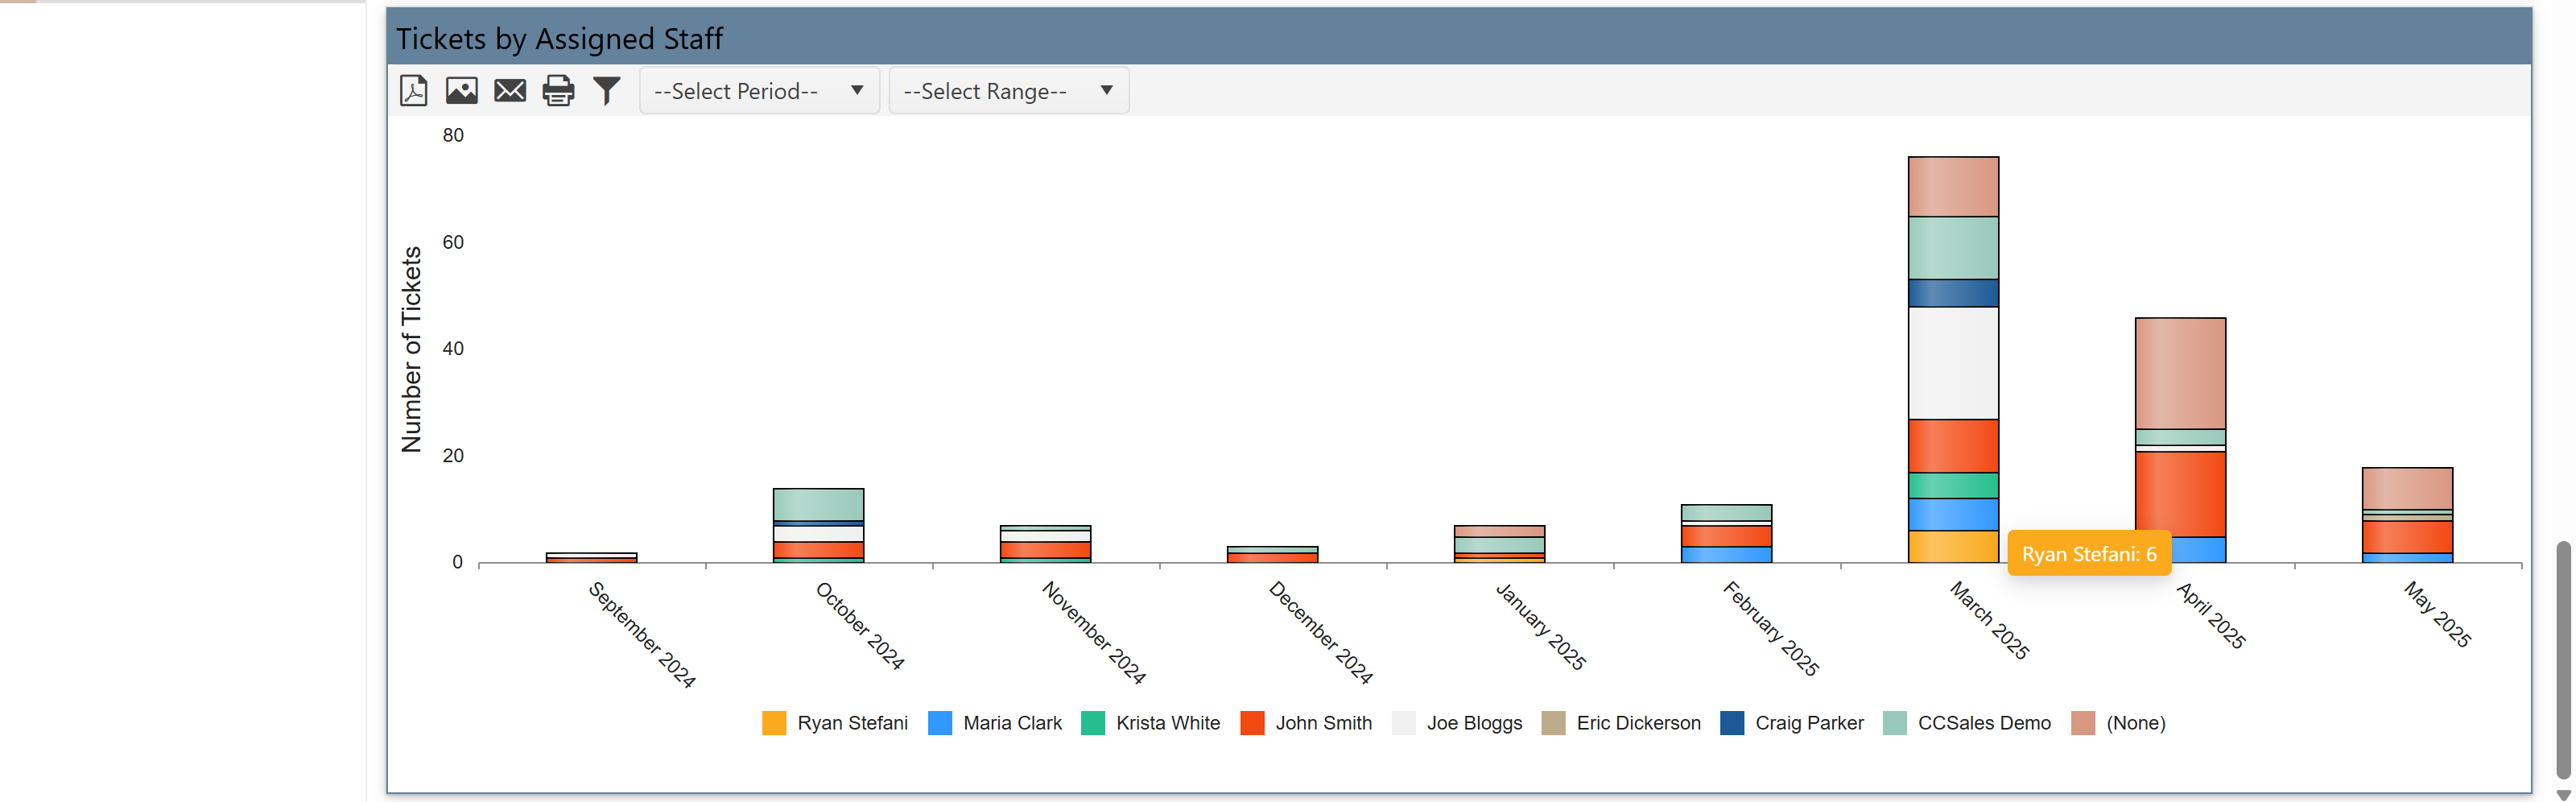
Tickets by Assigned Staff
It shows number of tickets handled by each staff member (like Ryan Matlock, Marco Cruz, etc.).
It is useful for performance tracking and balancing workloads among team members.