Problems by Period:
Problems List - Date Period Reports
This page allows you to filter the reports below by date periods (Current or Previous) Then by Range (Month, Quarter, Year, etc).
Simply change the Select Period and Select Range dropdowns on any report below to get the Date Period report desired.
View the report section below based on if you want the reporting date to be the Problems Created Date or Problems Closed Date. Then, the columns are stacked by various groupings (Category or Issue Type).
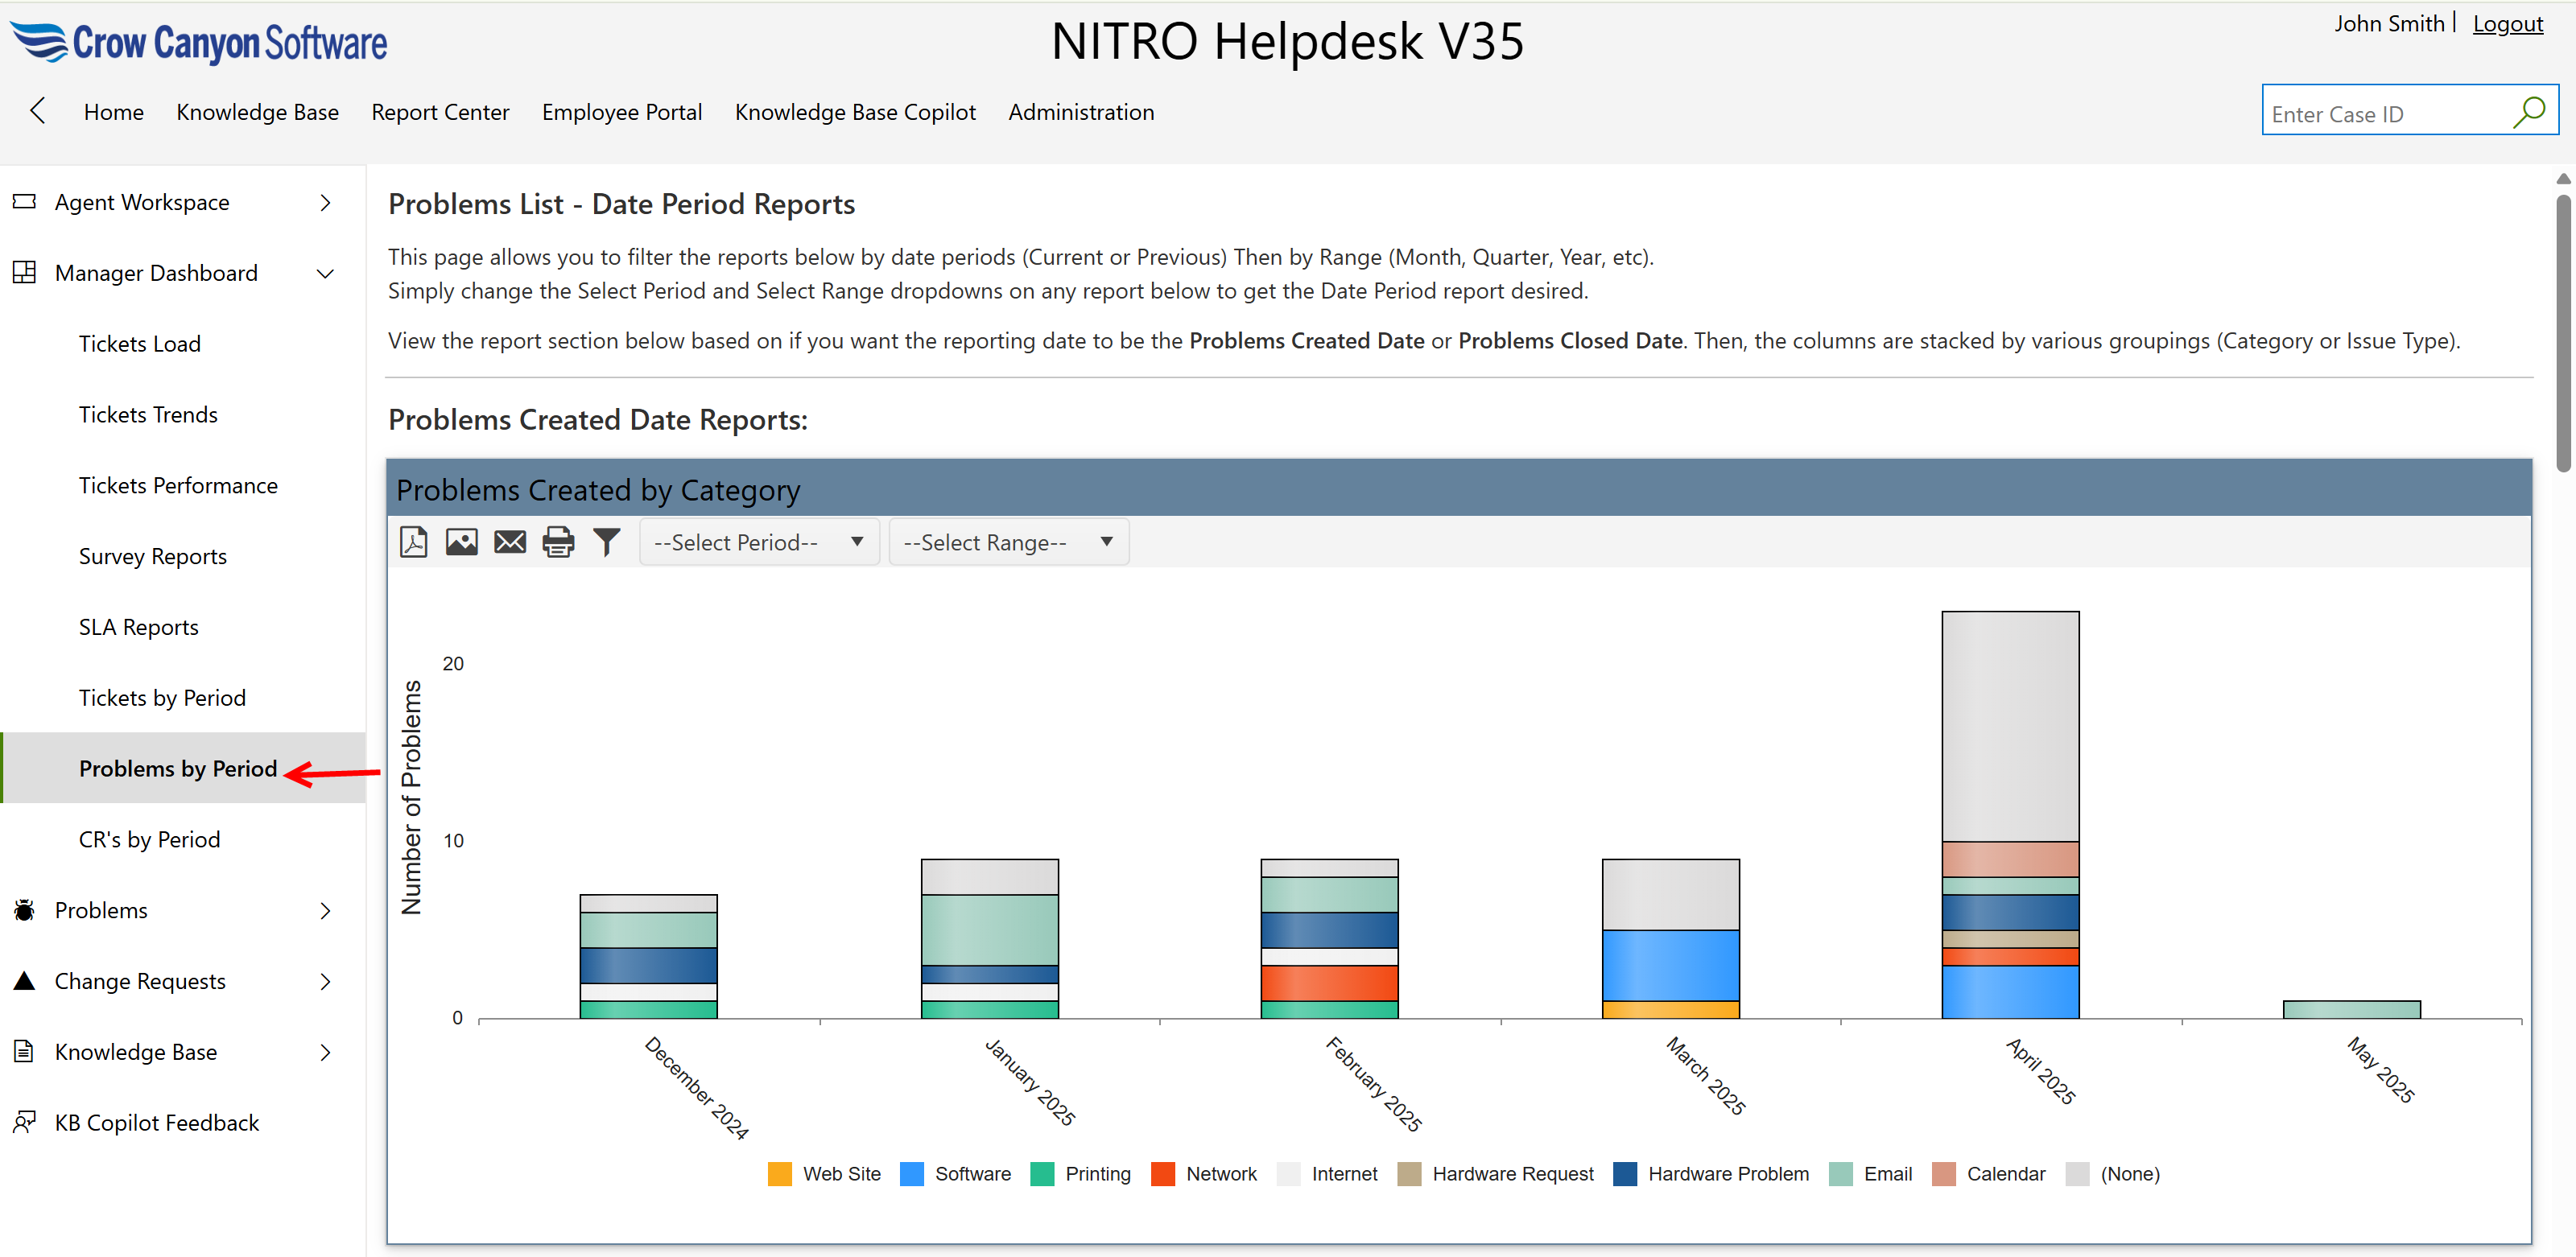
Problems Created Date Reports
These reports show the number of problems created during the selected date range.
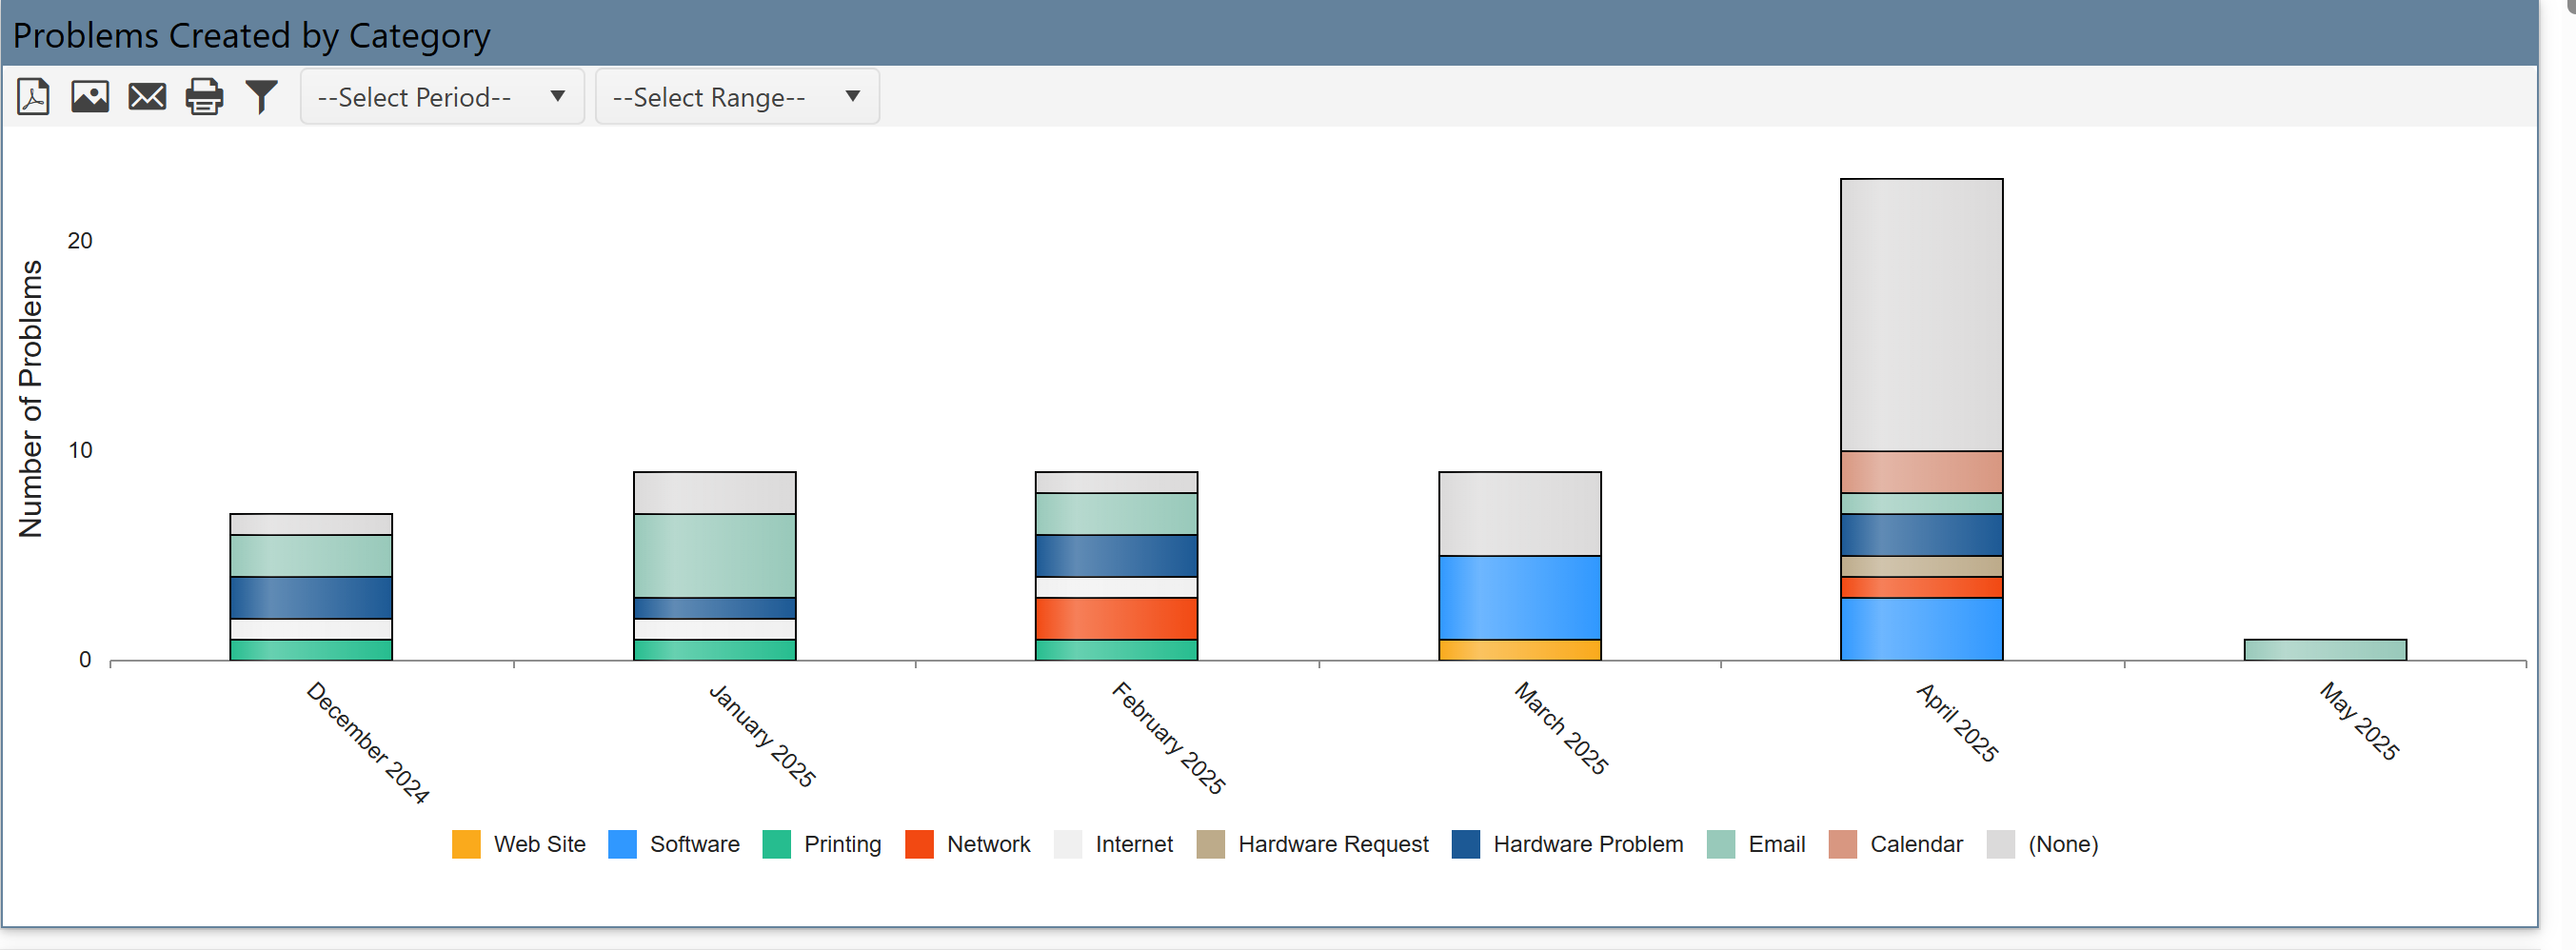
Problems Created by Category
•Displays how many problems were created in each category (e.g., VPN, Software, Hardware Problem).
•Each color segment shows a sub-division within that category.
•It identify which types of problems are reported most often.
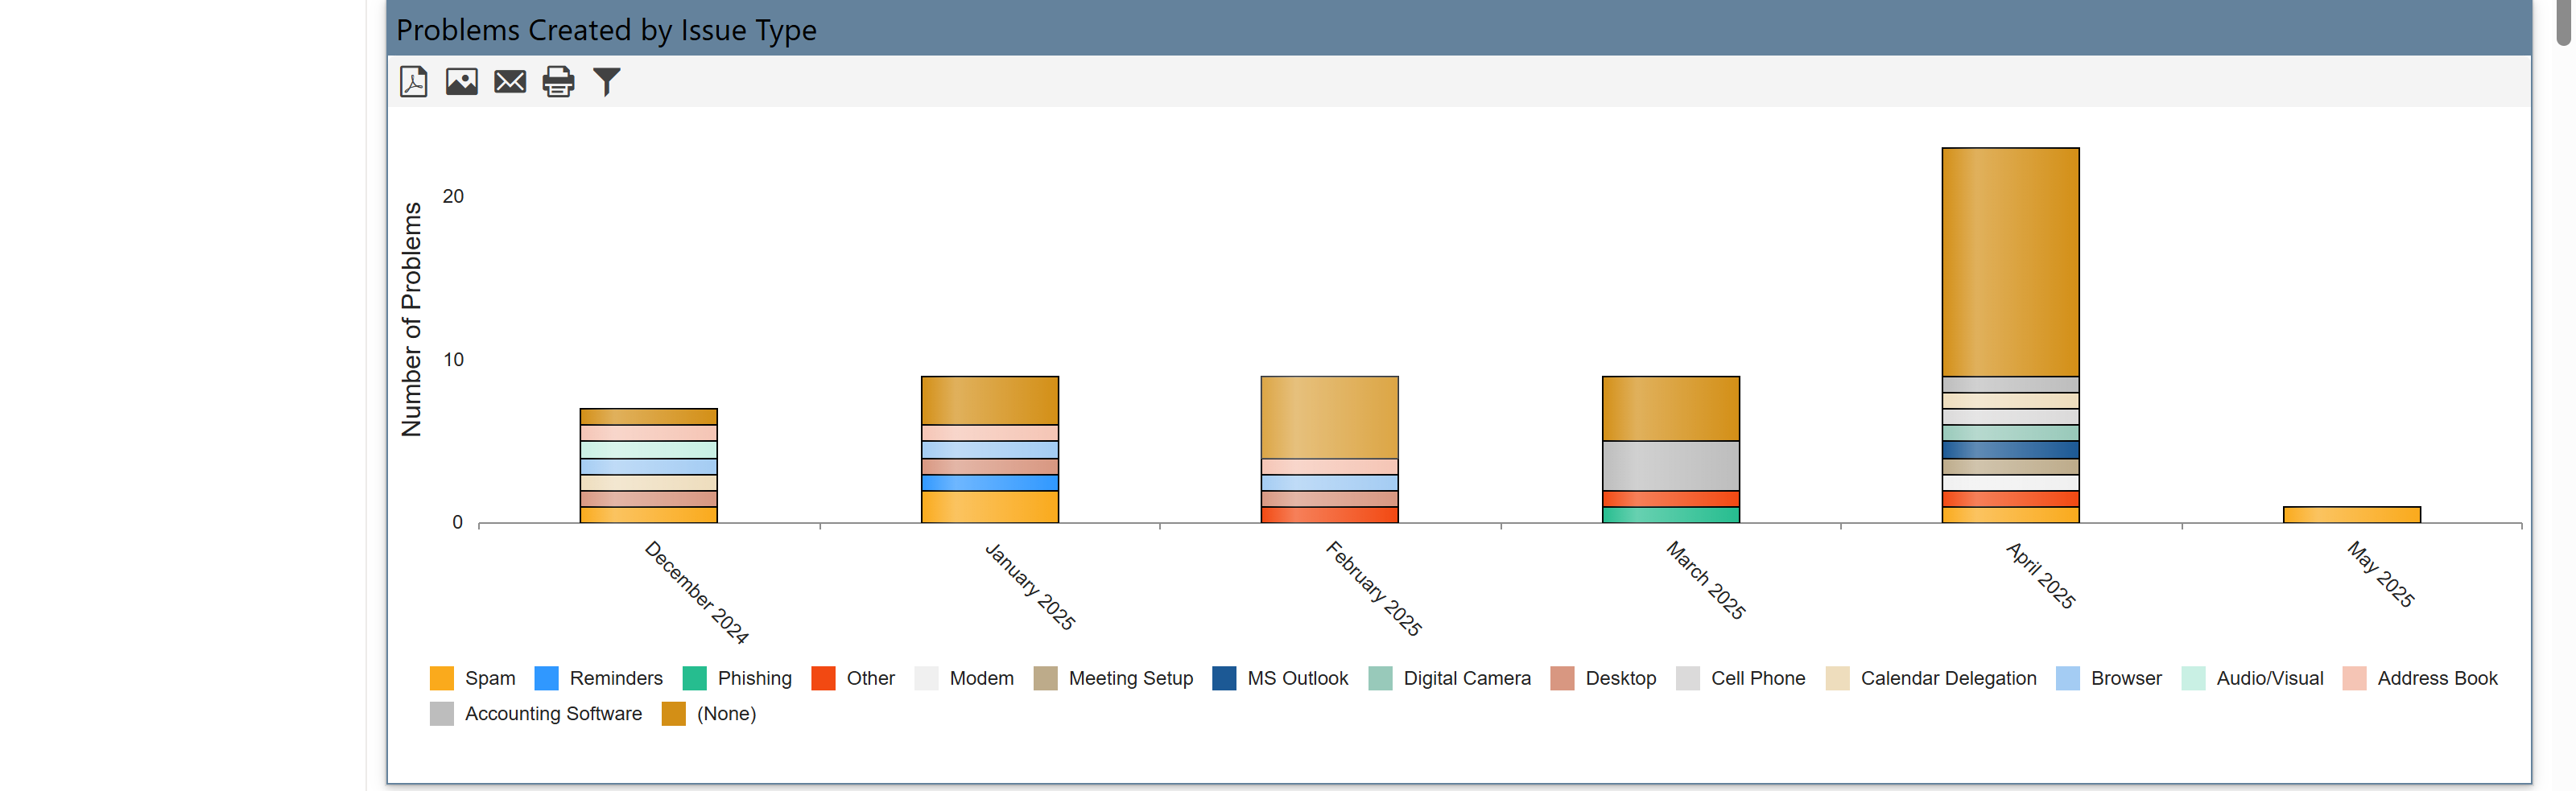
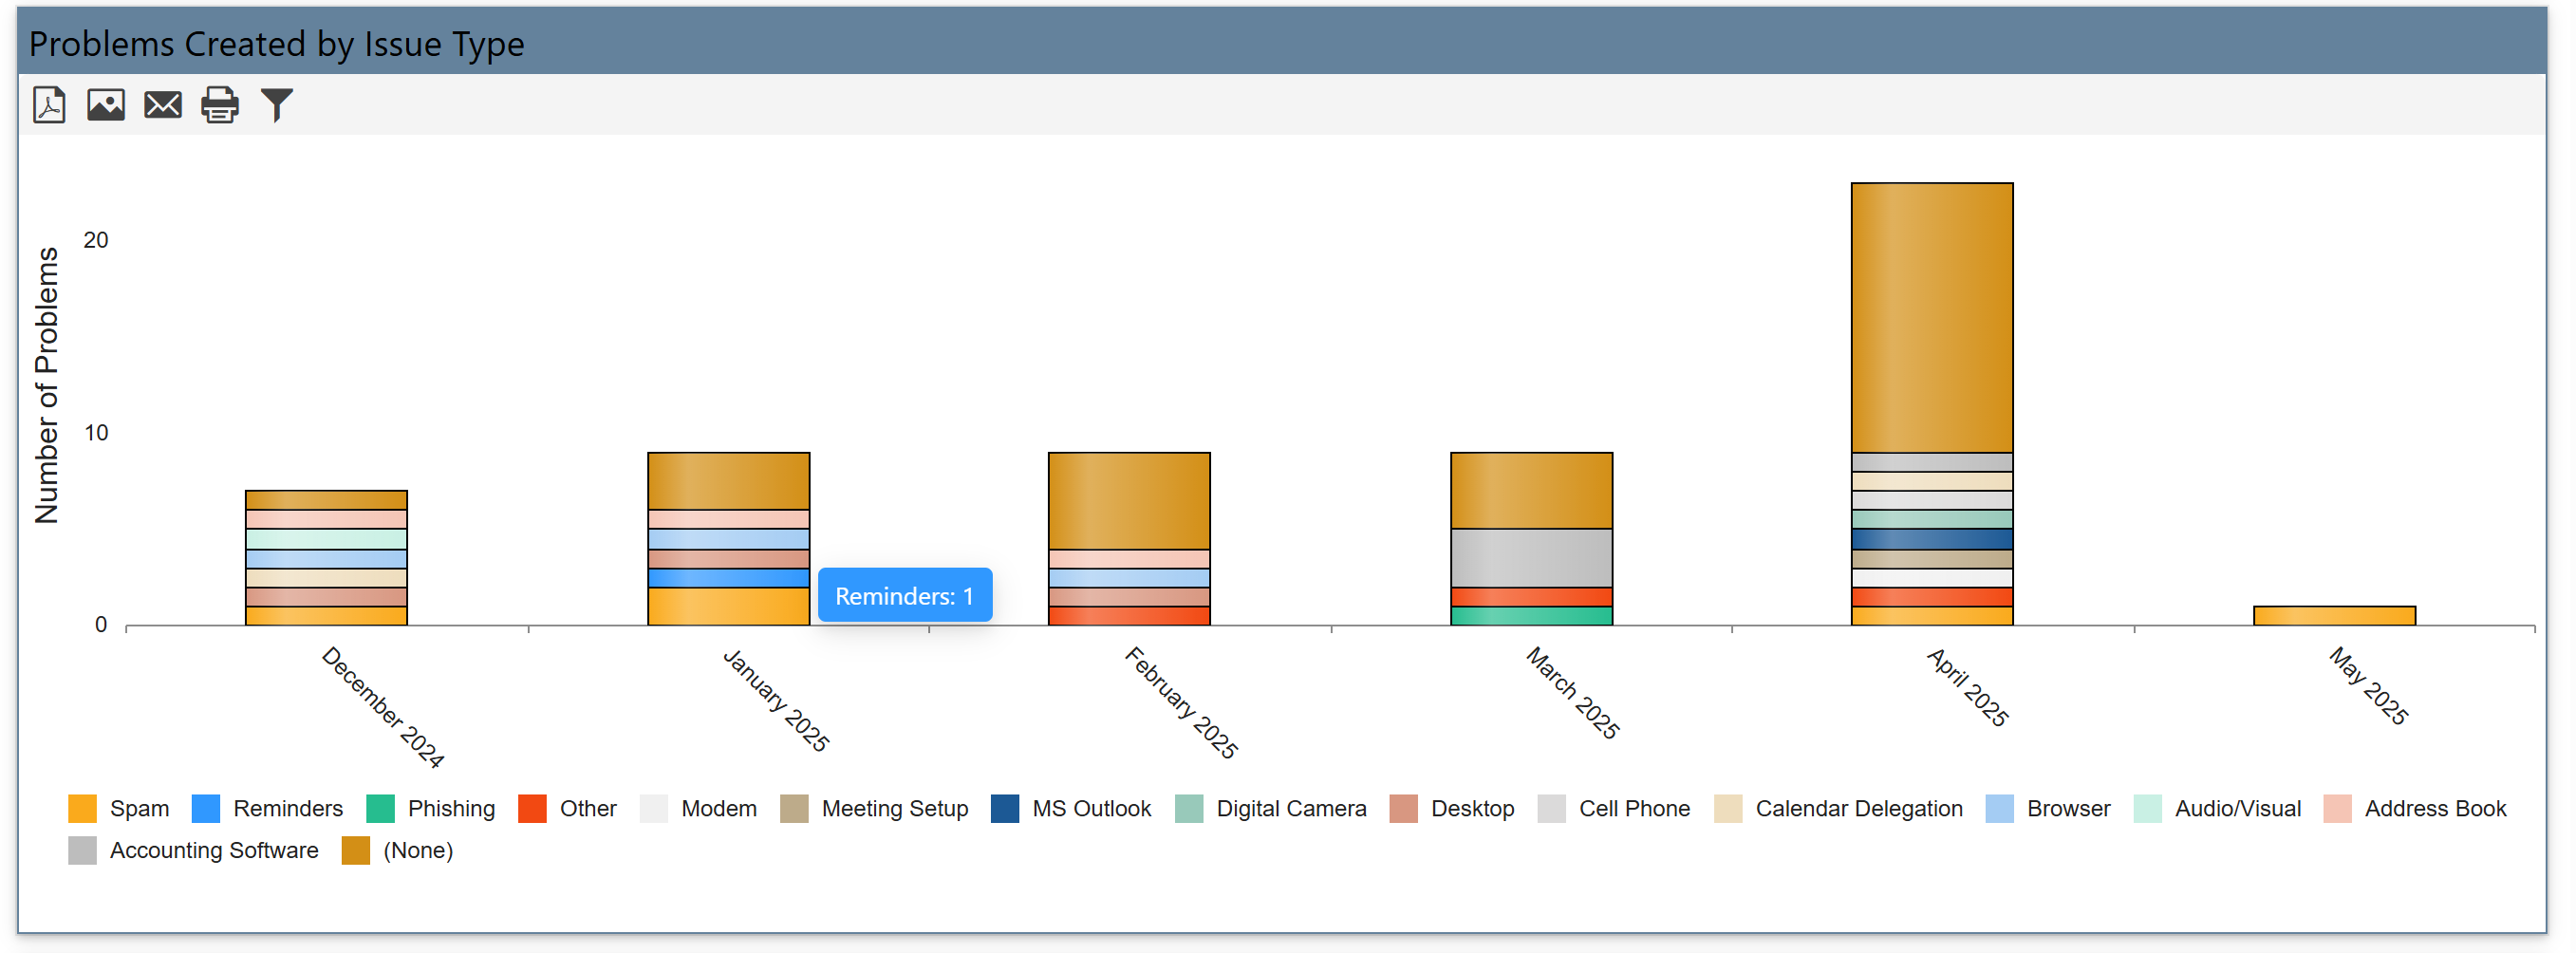
Problems Created by Issue Type
•Shows the number of problems created by specific issue types (e.g., VPN Issue, Printer Not Working, Outlook Crash).
•Stacked bars reflect various sub-issues grouped under issue type.
•It gives deeper insight into common problems users face.
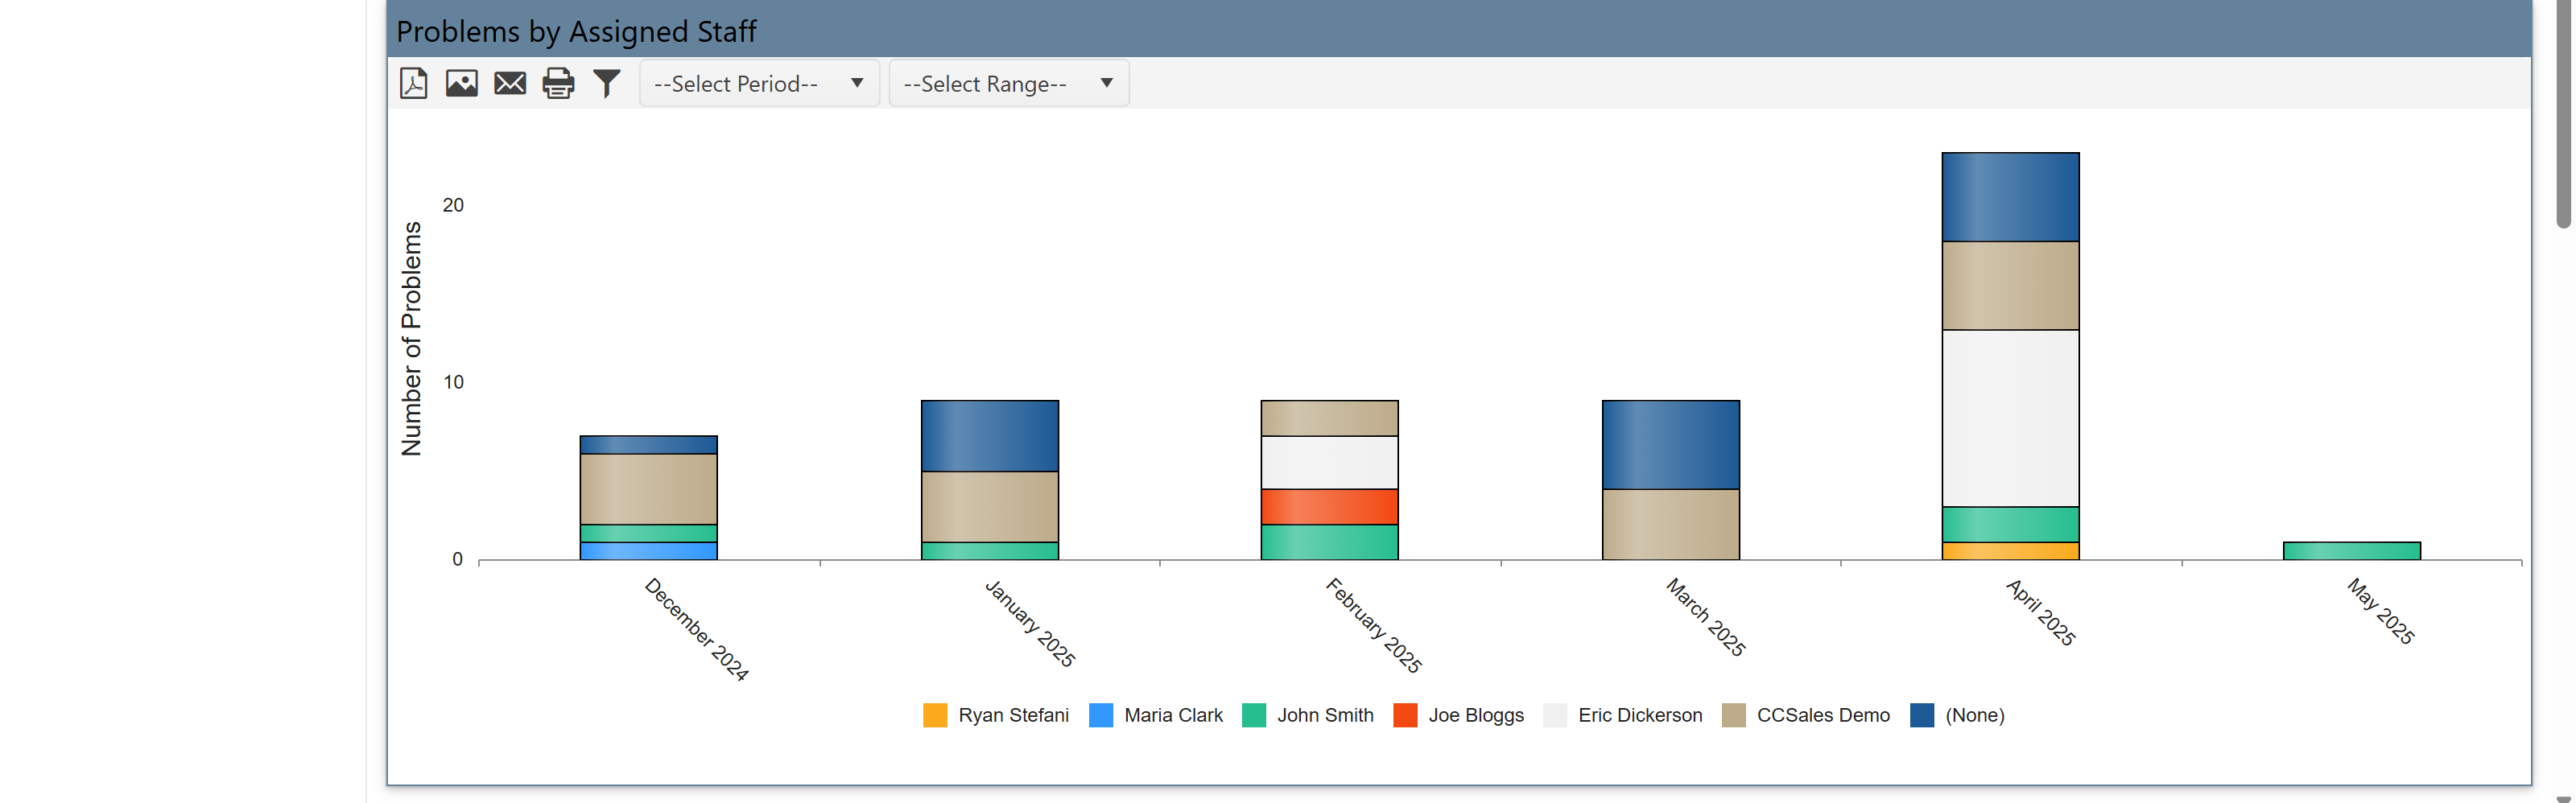
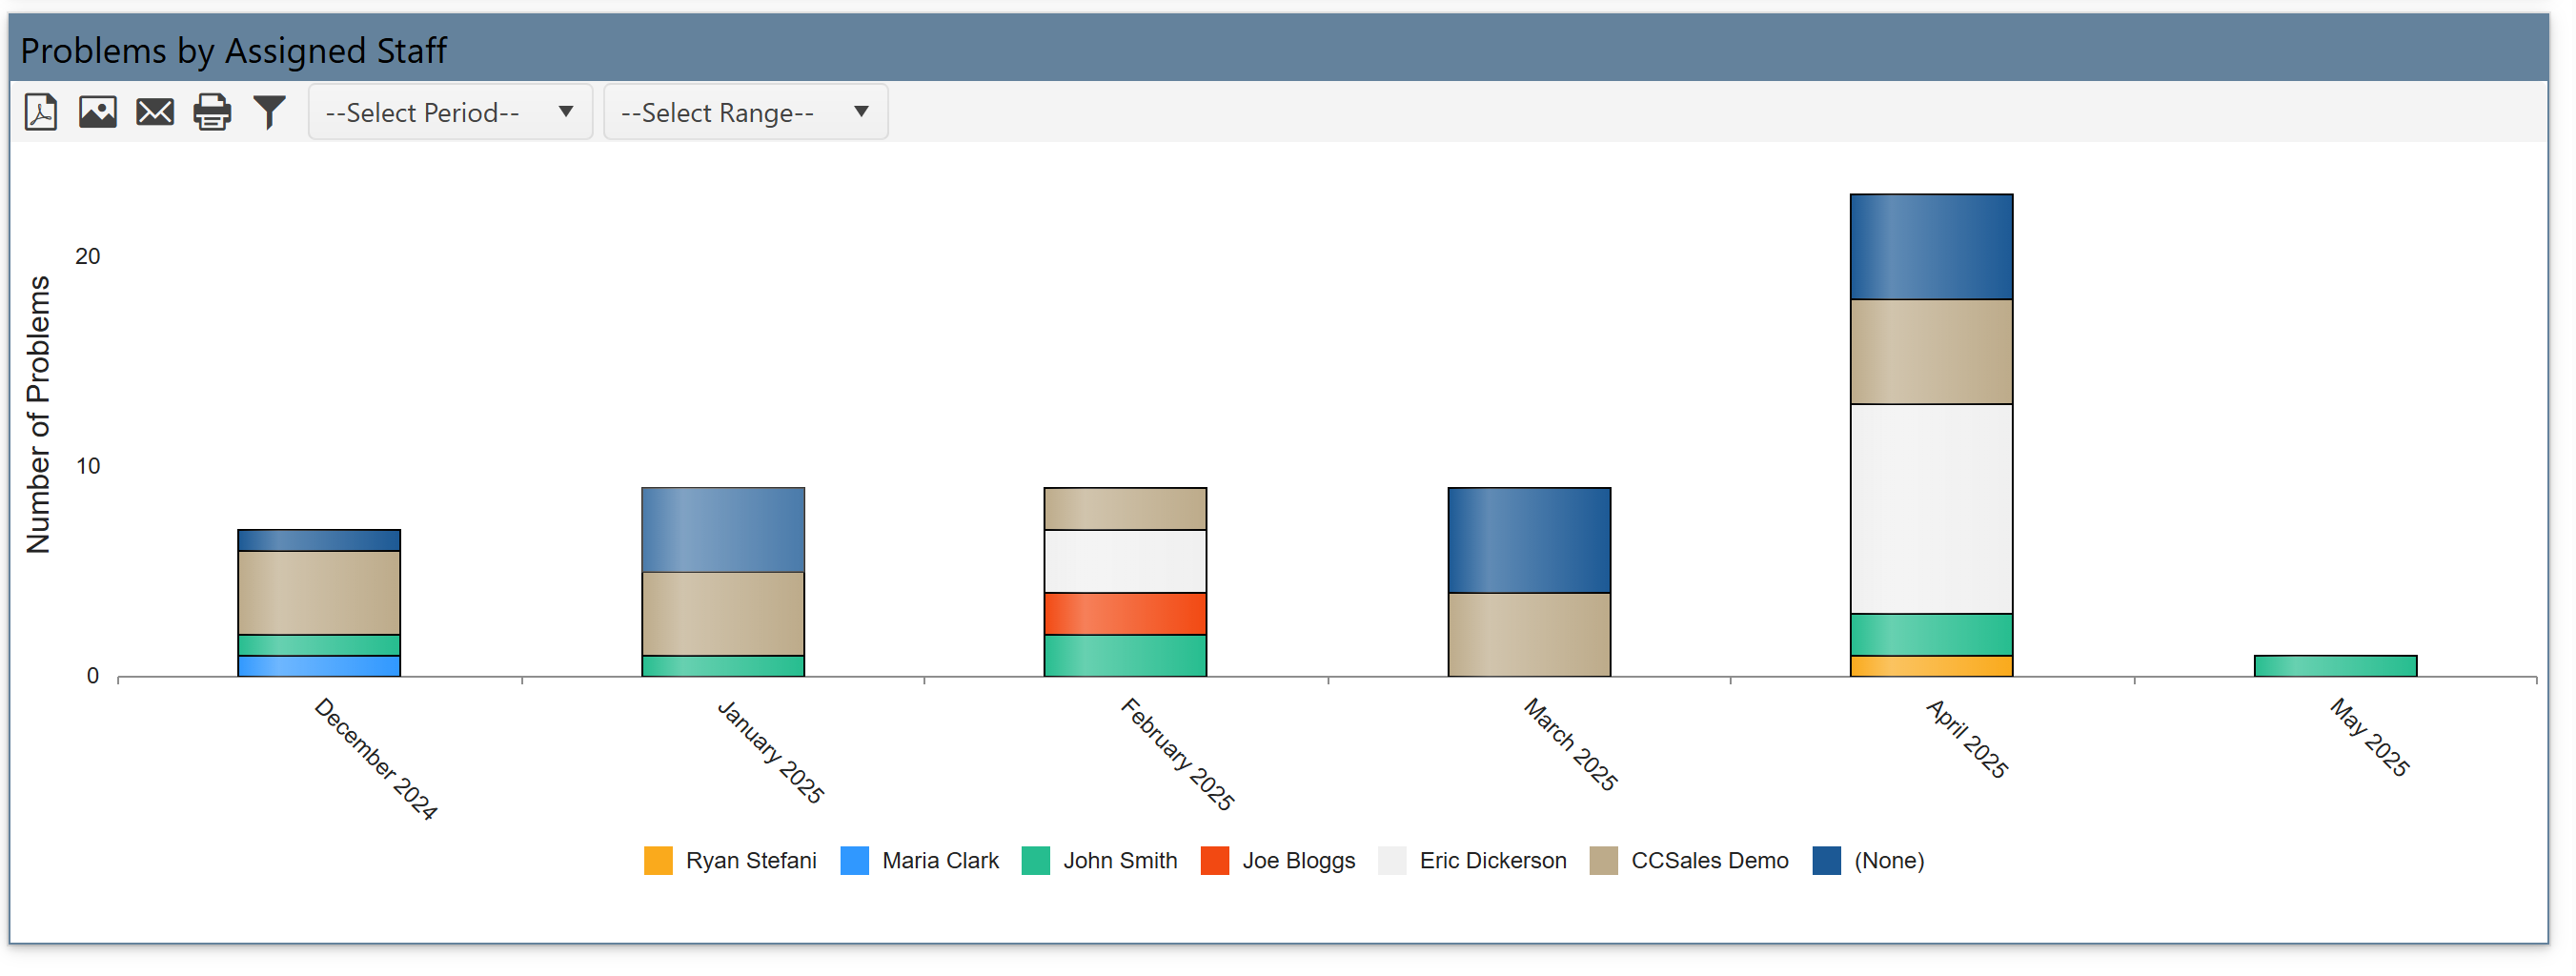
Problems by Assigned Staff
•Shows how many problems were assigned to each staff member (e.g., Ryan, Marco, Erica).
•Each bar shows how many problems were assigned and what types they were.
•It helps balance workloads and evaluate team performance.
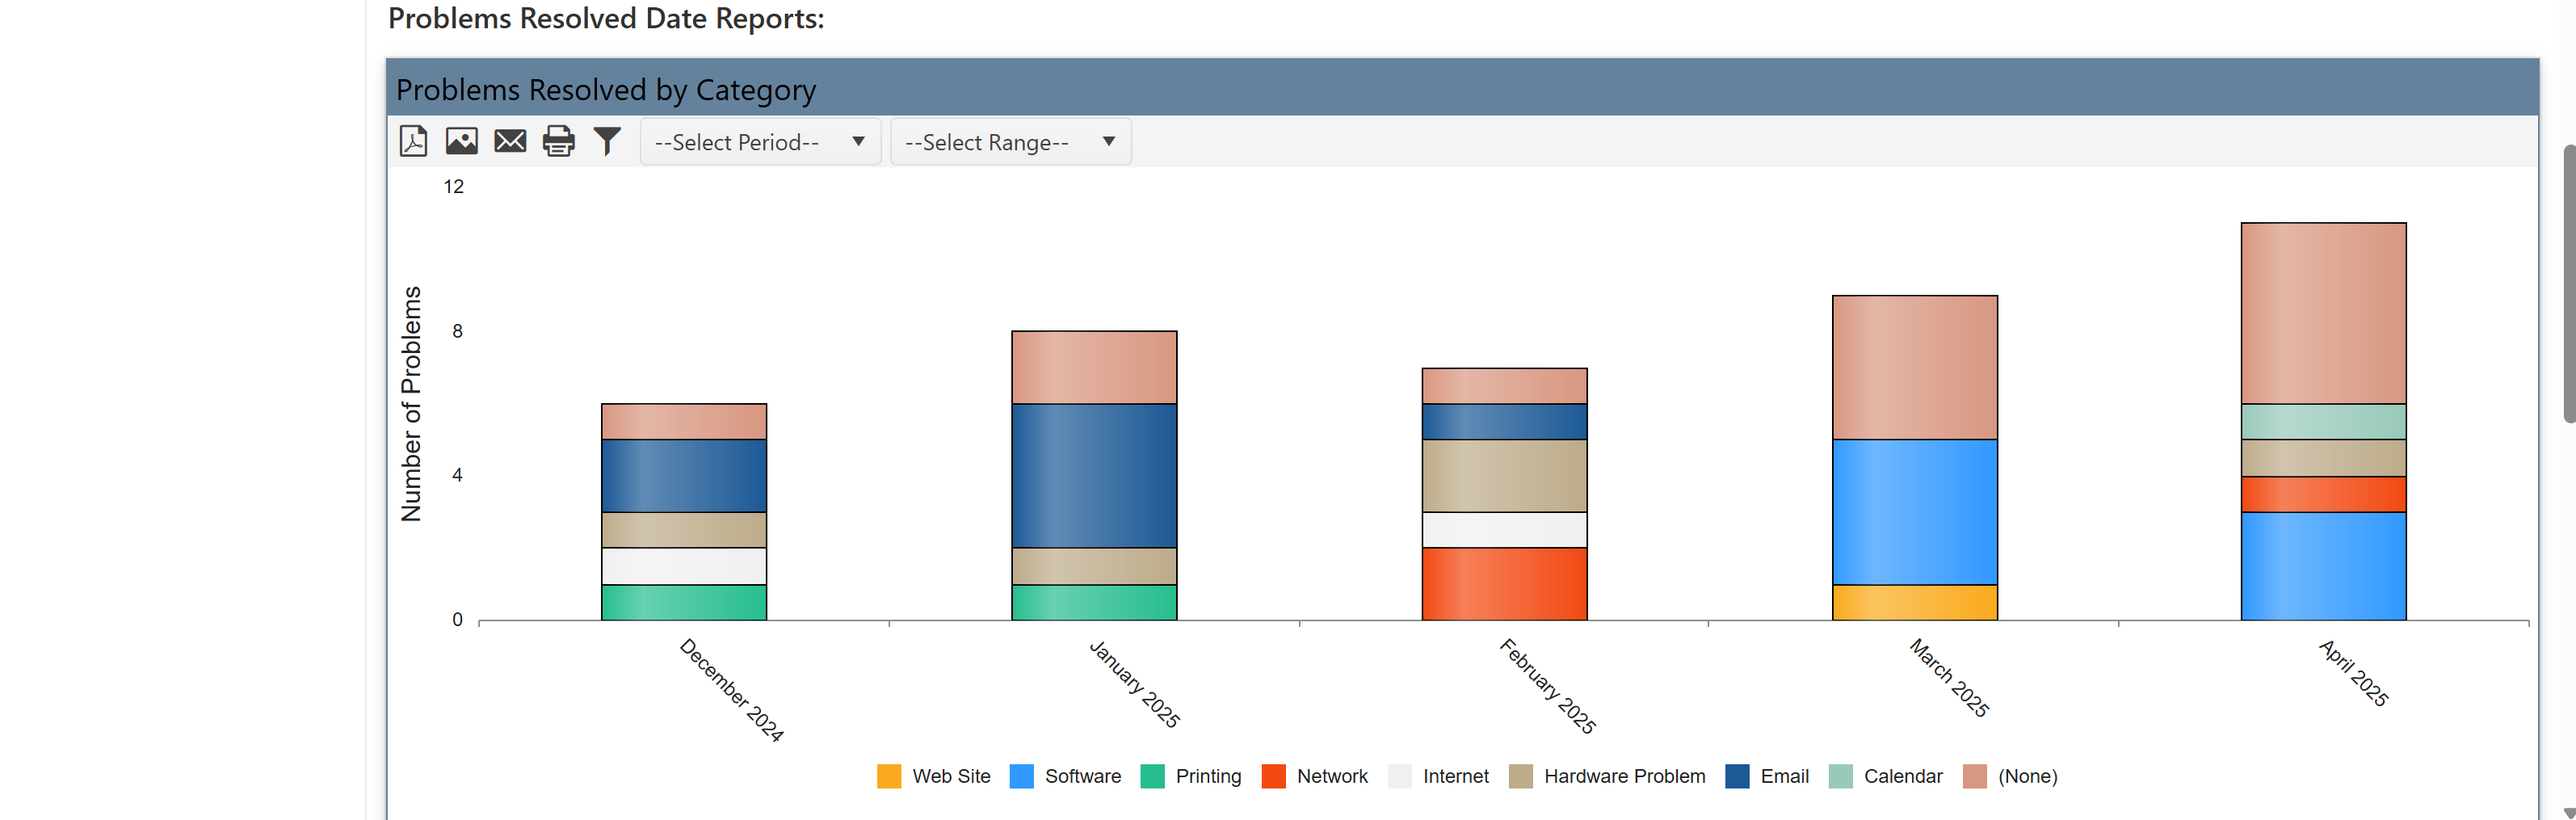
Problems Resolved Date Reports
These reports show how many problems were resolved, grouped similarly.
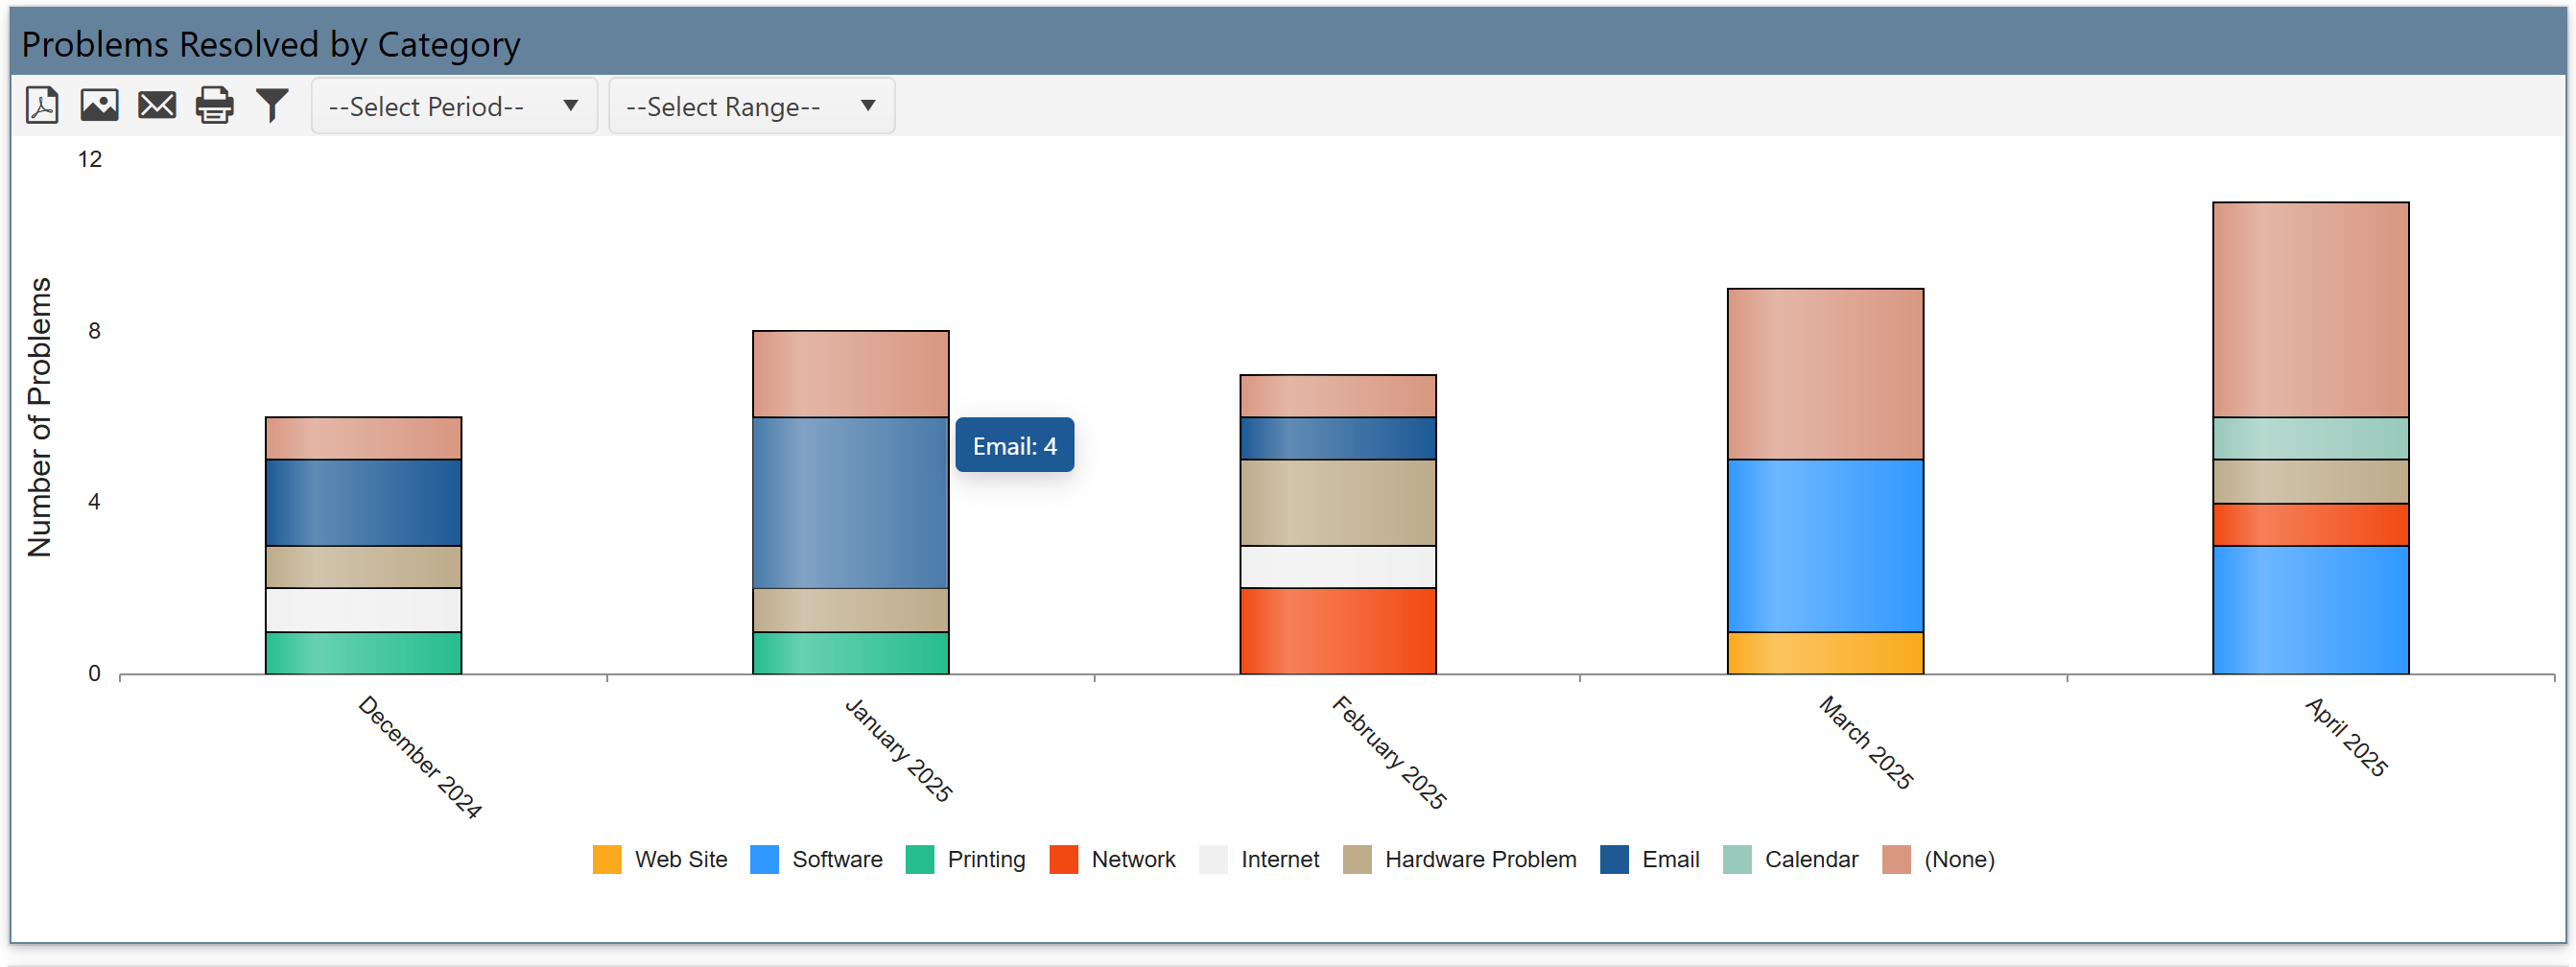
Problems Resolved by Category
•Shows how many problems were resolved in each category (same as categories on the left).
•Bars are split to show sub-items within categories.
•It track problem resolution and compare it to problems created.
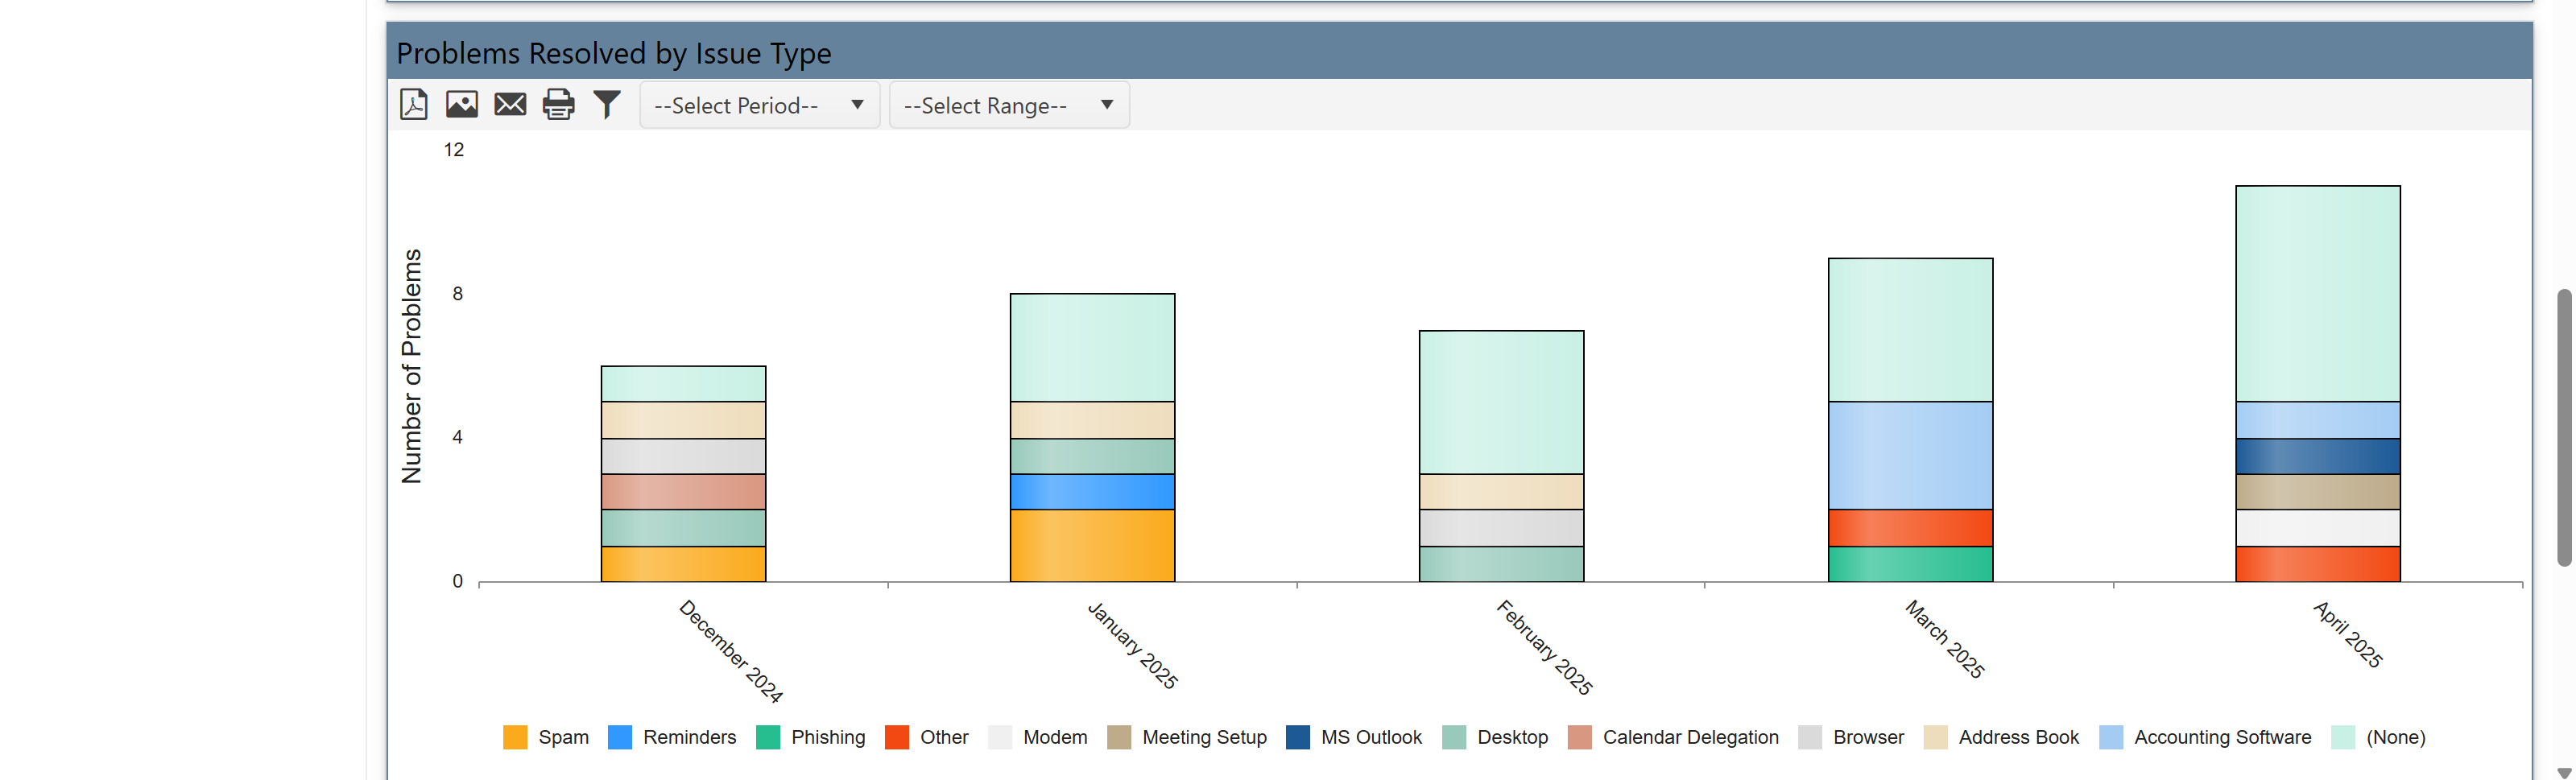
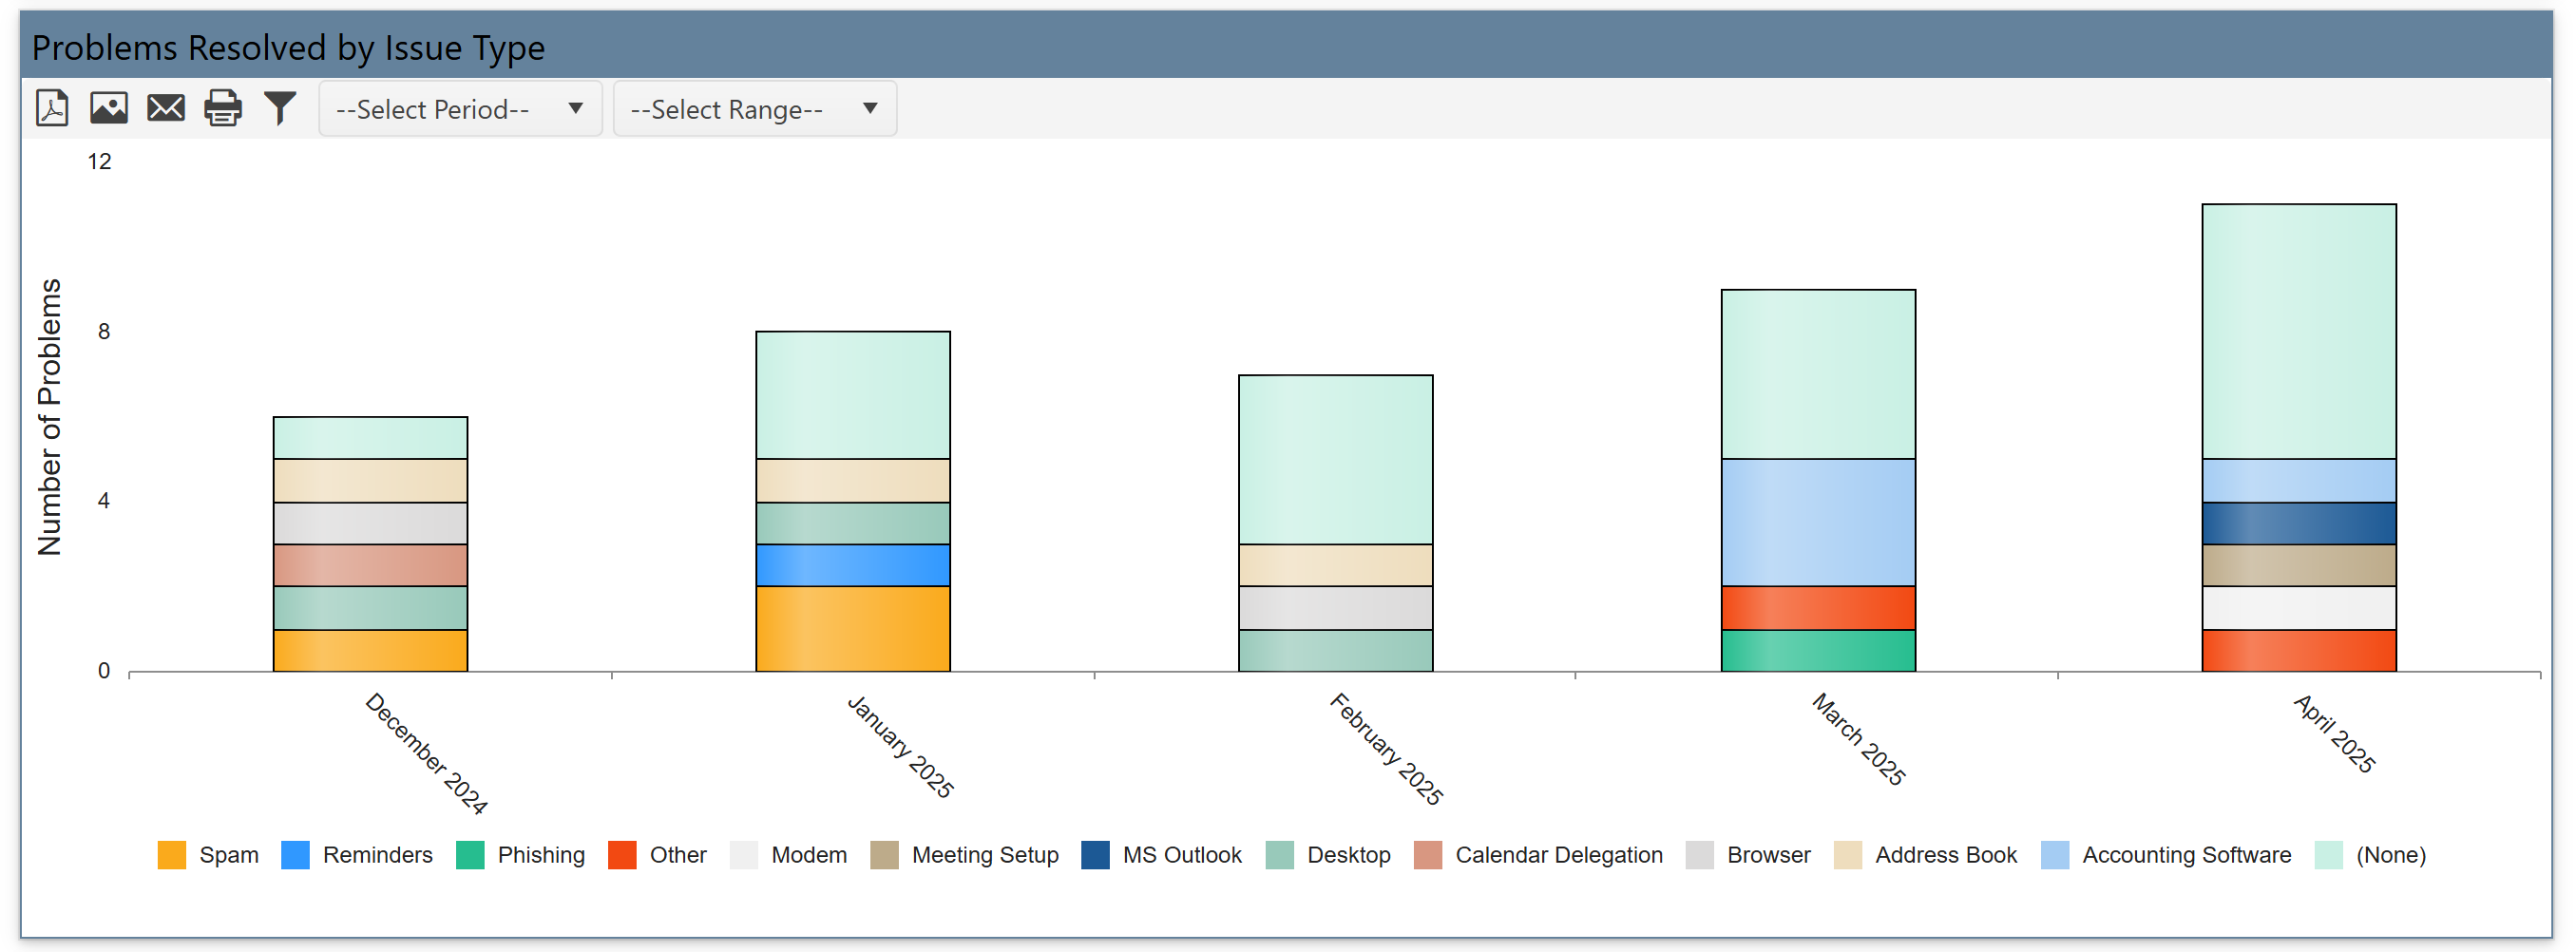
Problems Resolved by Issue Type
•Displays how many issues of each issue type were resolved.
•Stacked color bars represent different types of problems under each group.
•It analyze what kinds of problems are being resolved over time.
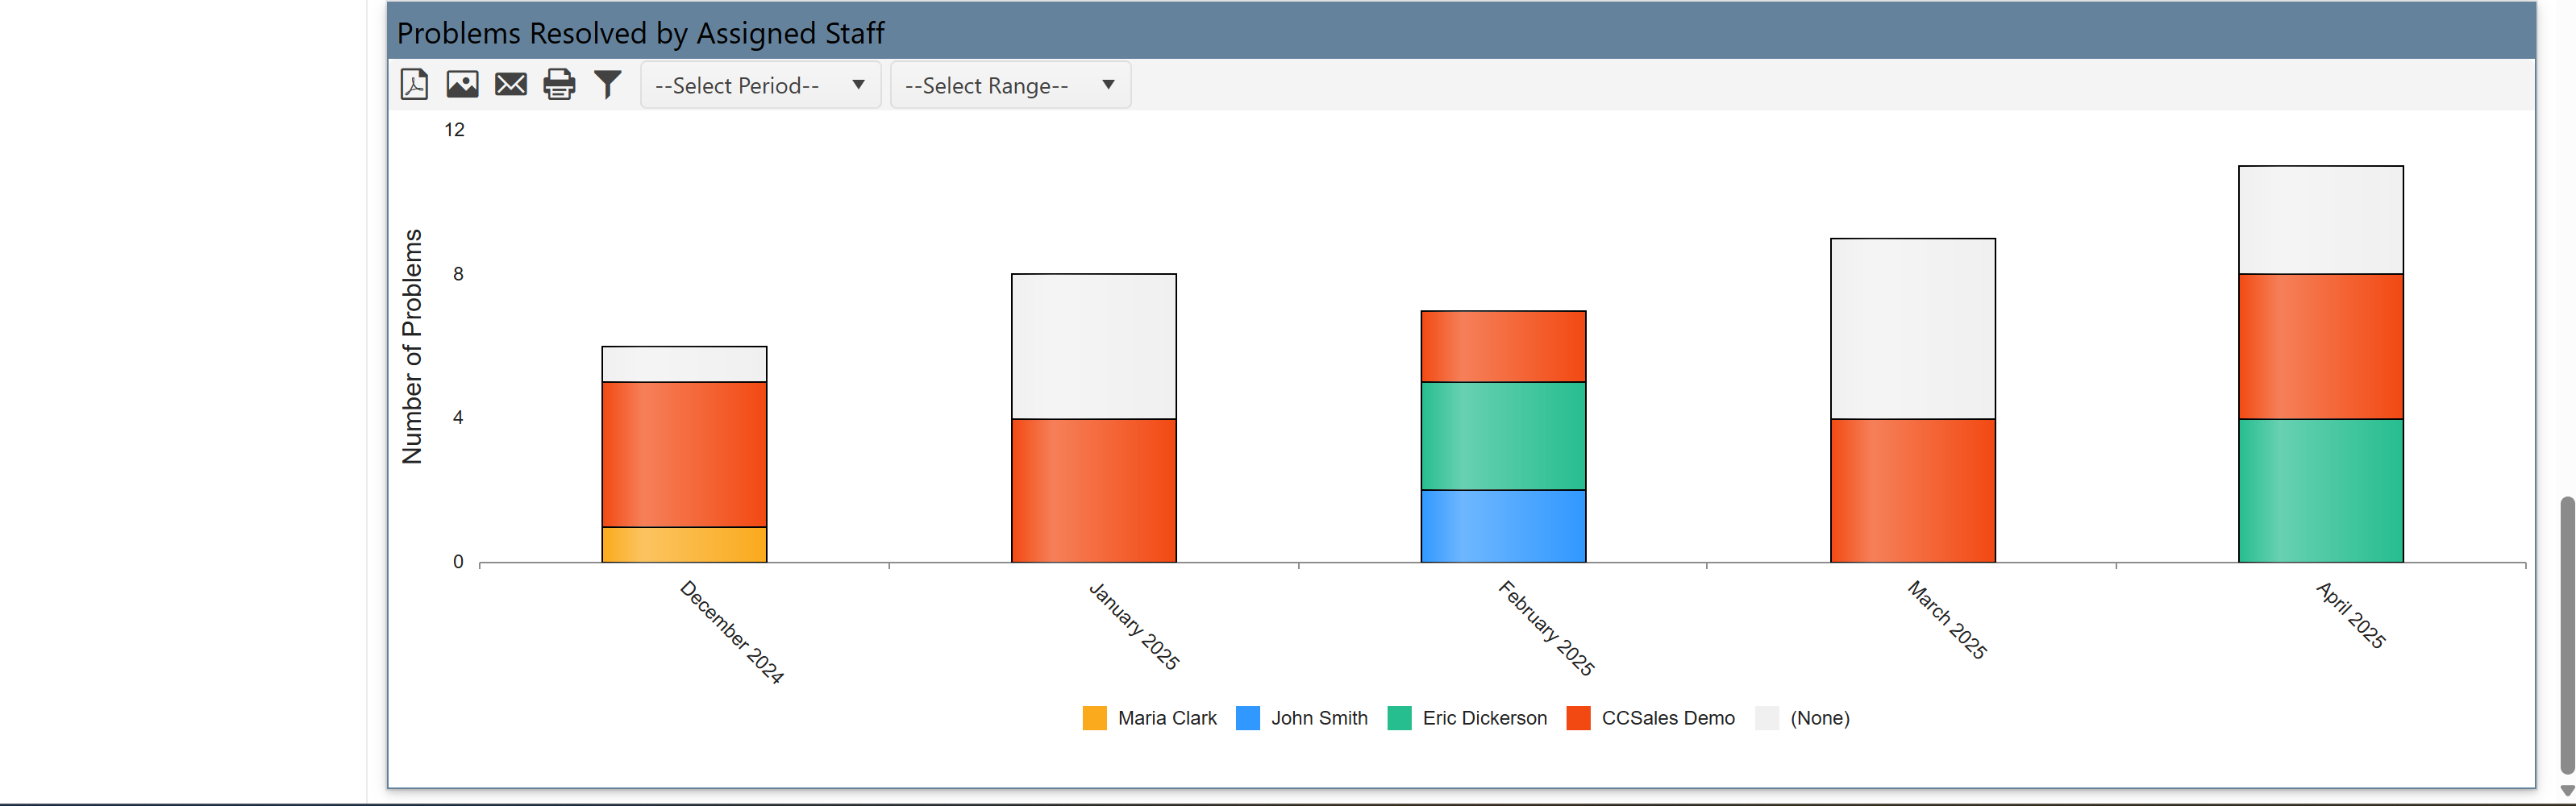
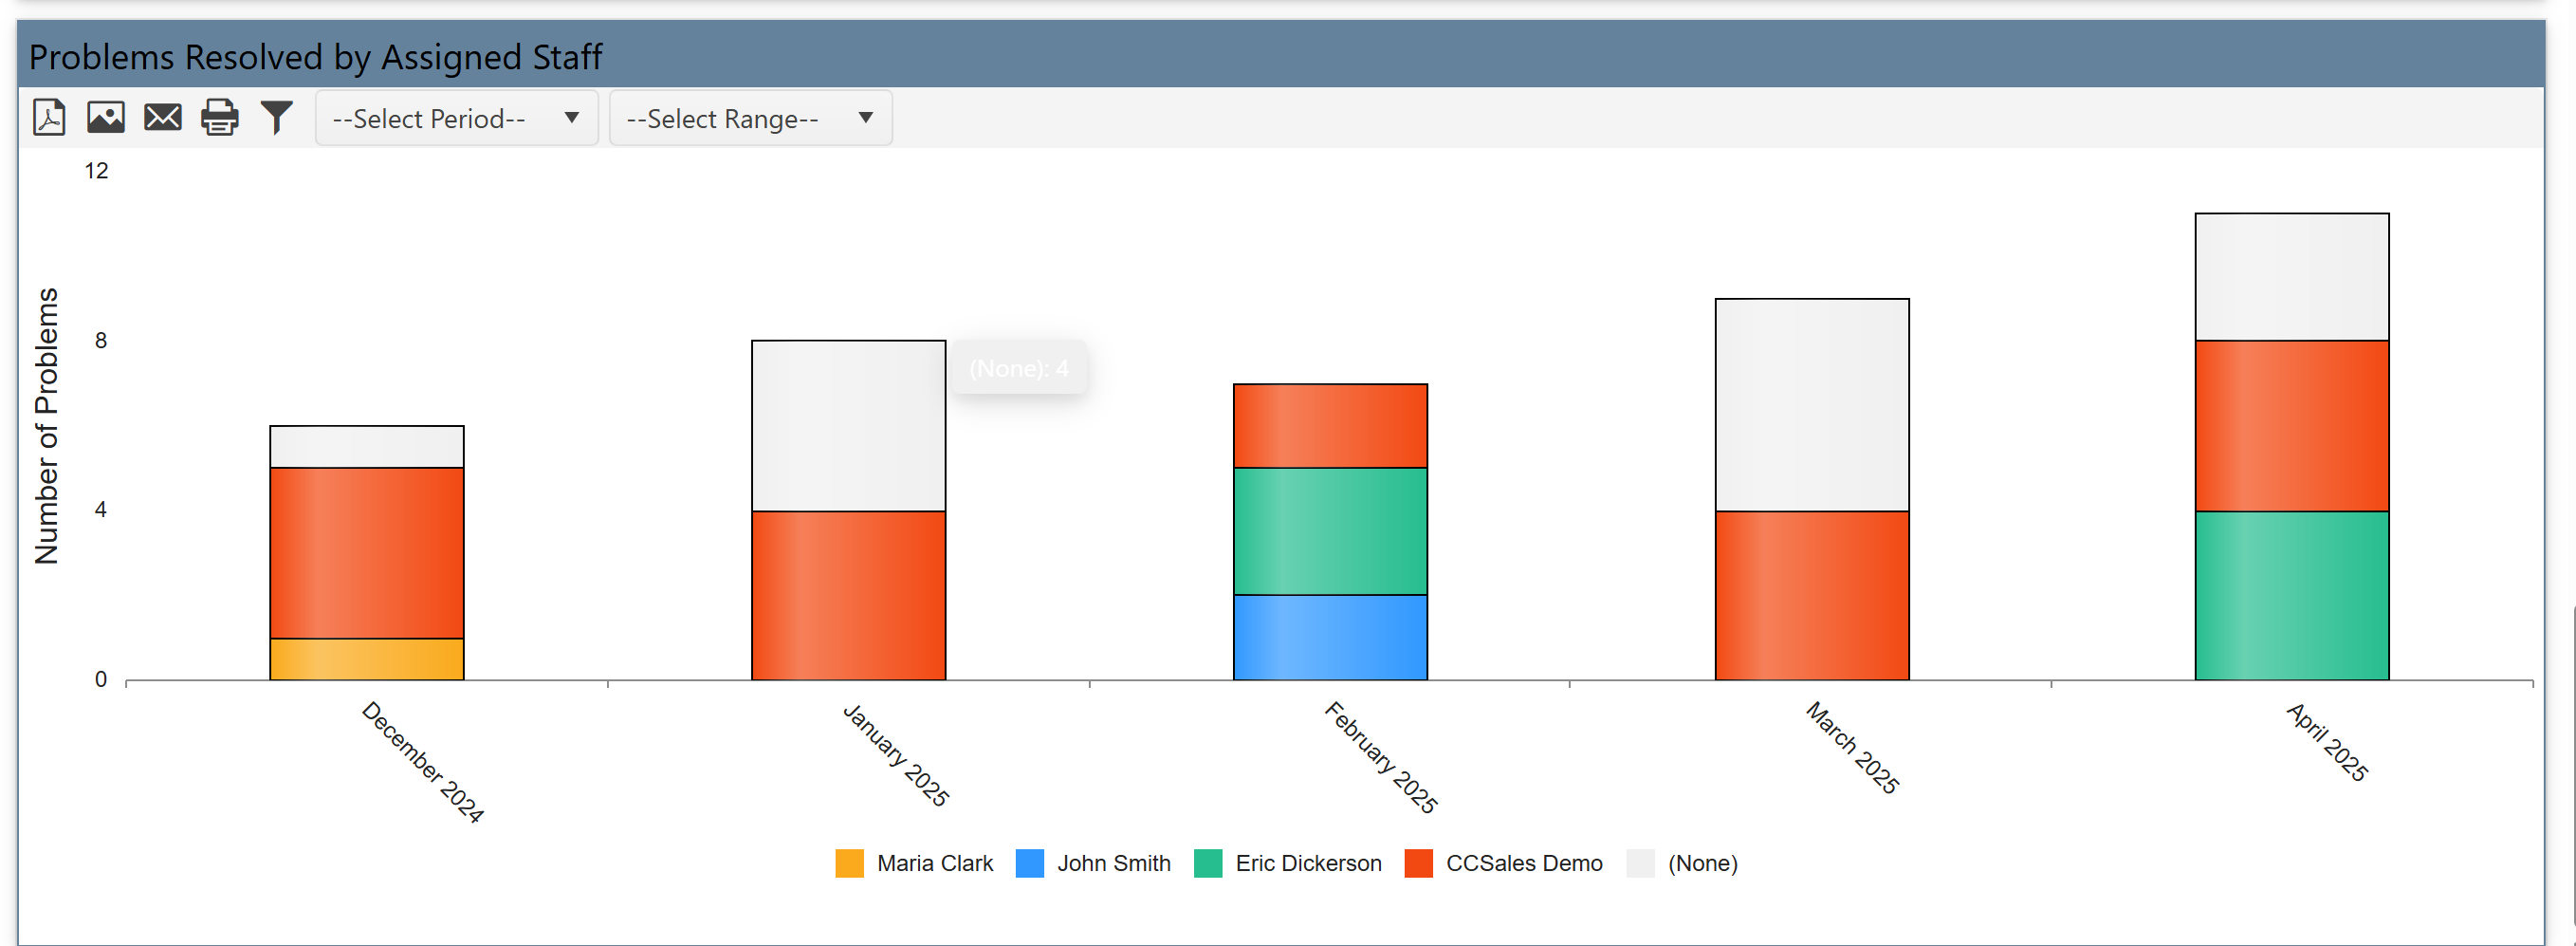
Problems Resolved by Assigned Staff
•Shows how many problems each staff member resolved.
•Each colored section shows different issues resolved by a staff.
•It helps identify high performers or staff needing support.
You can filter these reports by:
•Date Range (Month, Quarter, Year)
•Period Type (Current or Previous)
Use dropdowns (“Select Period” and “Select Range”) to control the report’s timeframe.
Reports are grouped based on:
•Created Date or Resolved Date
•And further broken down by Category, Issue Type, or Assigned Staff
This dashboard page is a powerful view that:
•Compares what types of issues are reported vs. resolved
•Tracks issues by team, department, or type
•Filters by custom date periods
•Helps measure support efficiency and problem trends