CR’s by Period:
Change Requests List - Date Period Reports
This page allows you to filter the reports below by date periods (Current or Previous) Then by Range (Month, Quarter, Year, etc).
Simply change the Select Period and Select Range dropdowns on any report below to get the Date Period report desired.
View the report section below based on if you want the reporting date to be the Change Requests Created Date or Change Requests Closed Date. Then, the columns are stacked by various groupings (Change Type, Owner, or Department).
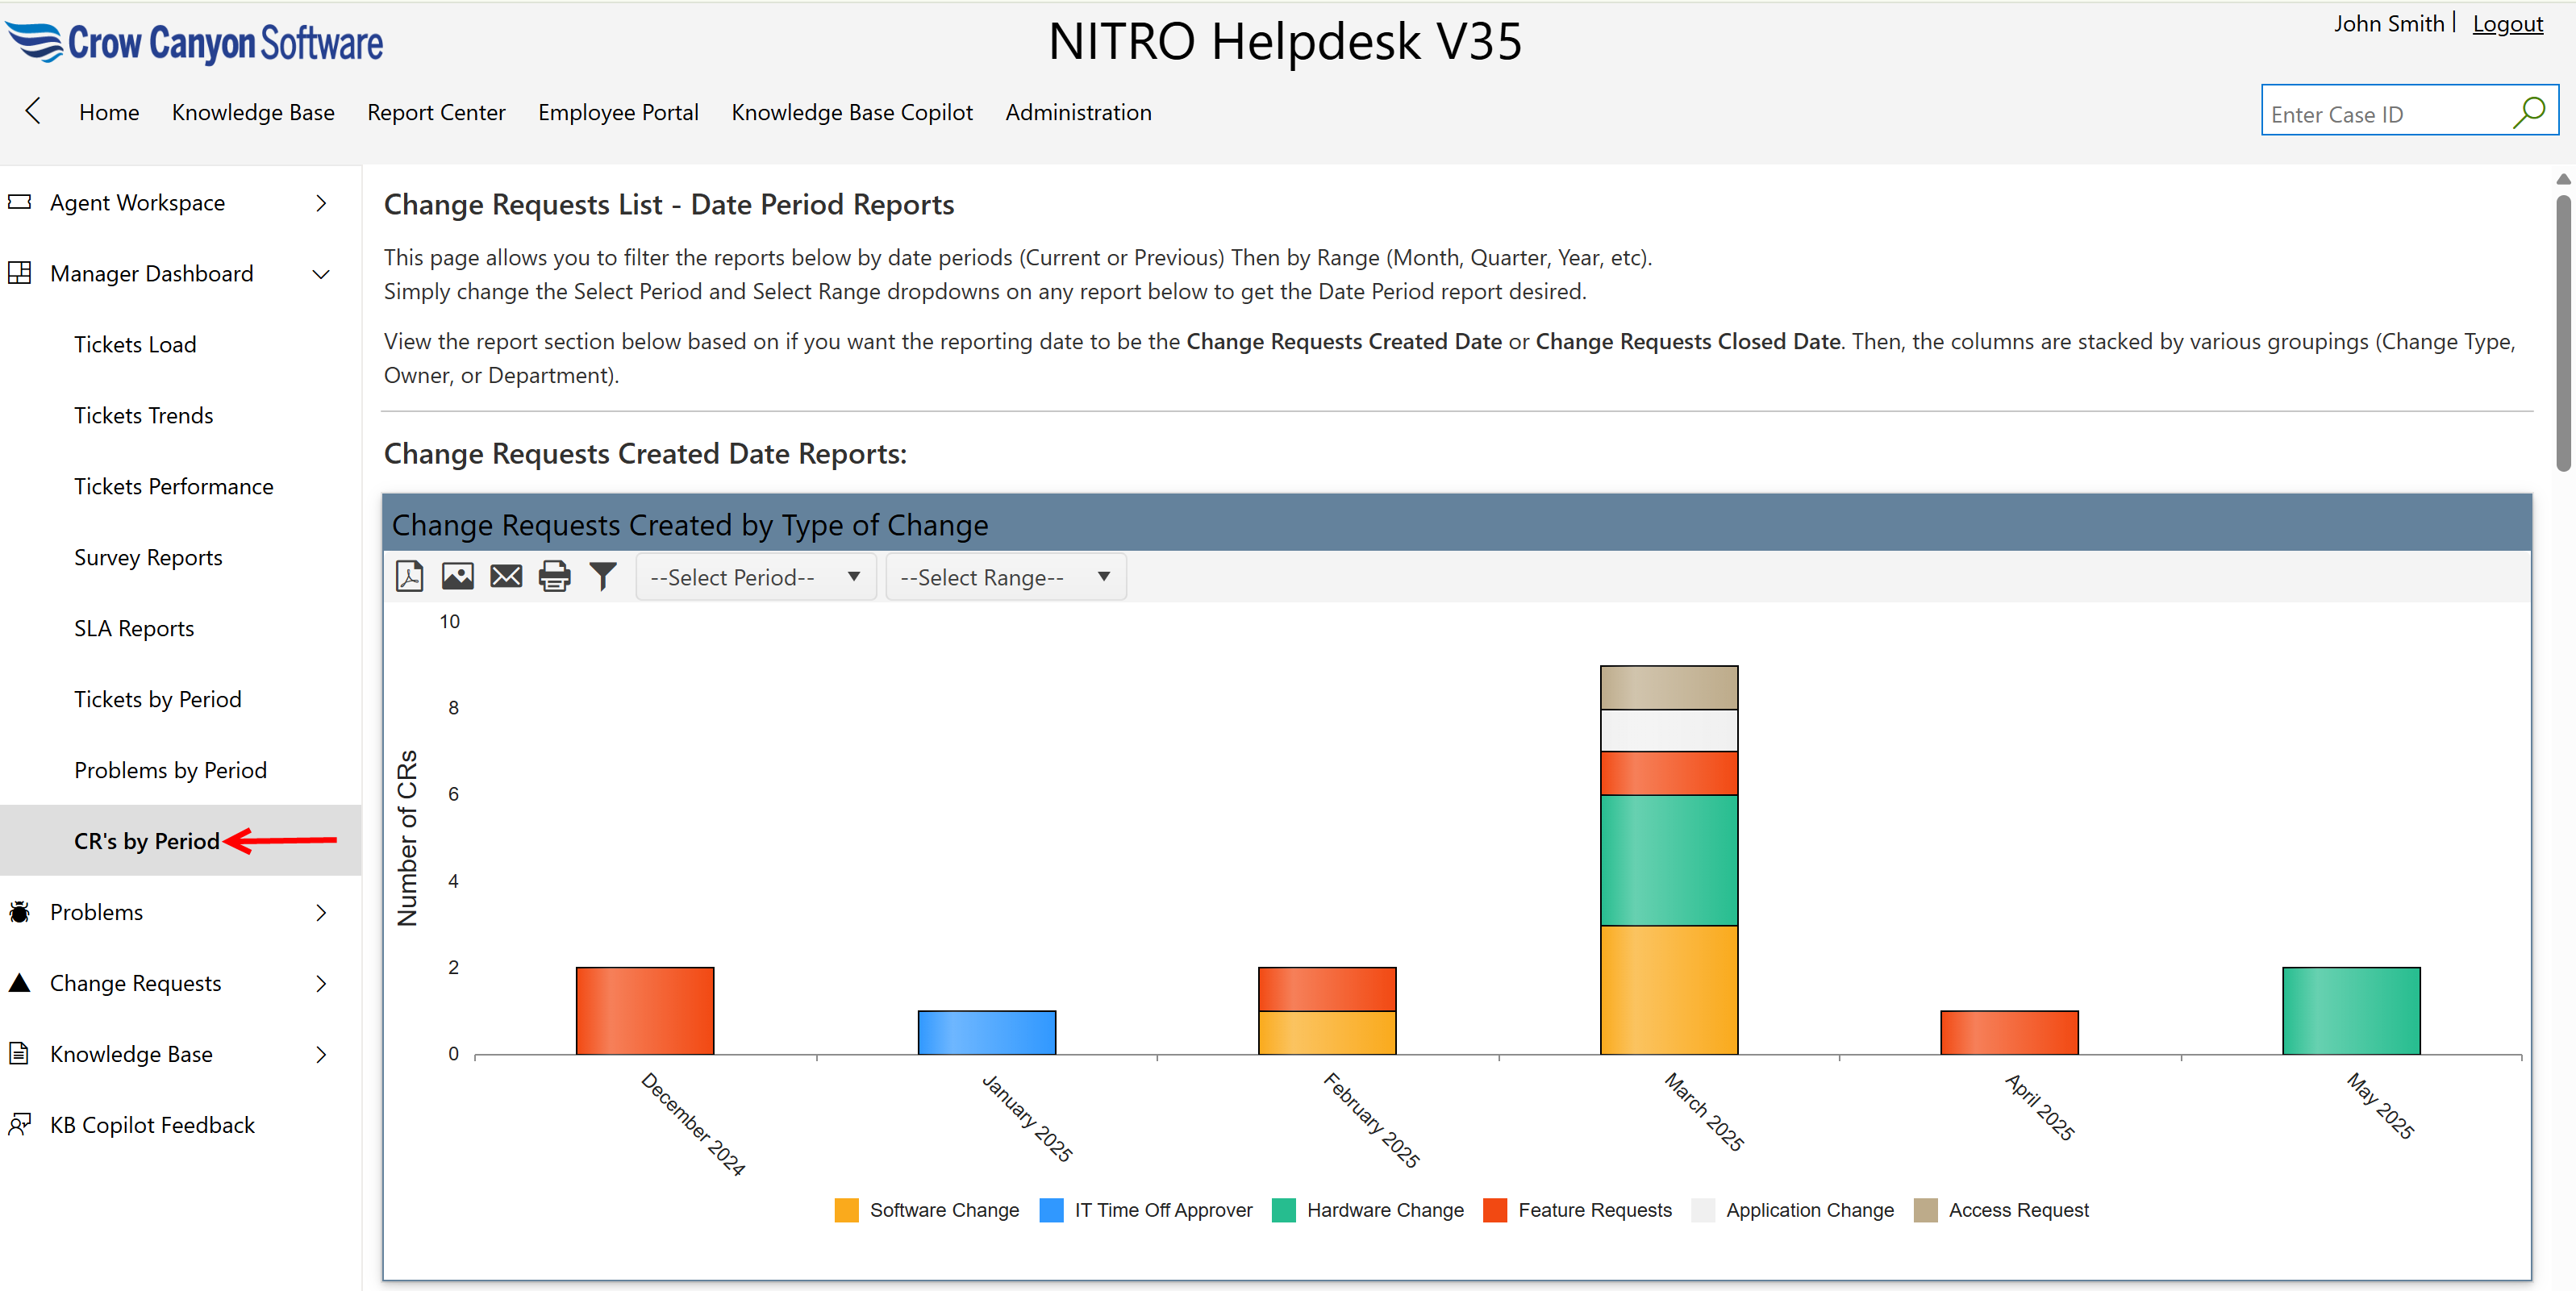
Change Requests Created Date Reports
These reports show how many Change Requests were created during a selected period.
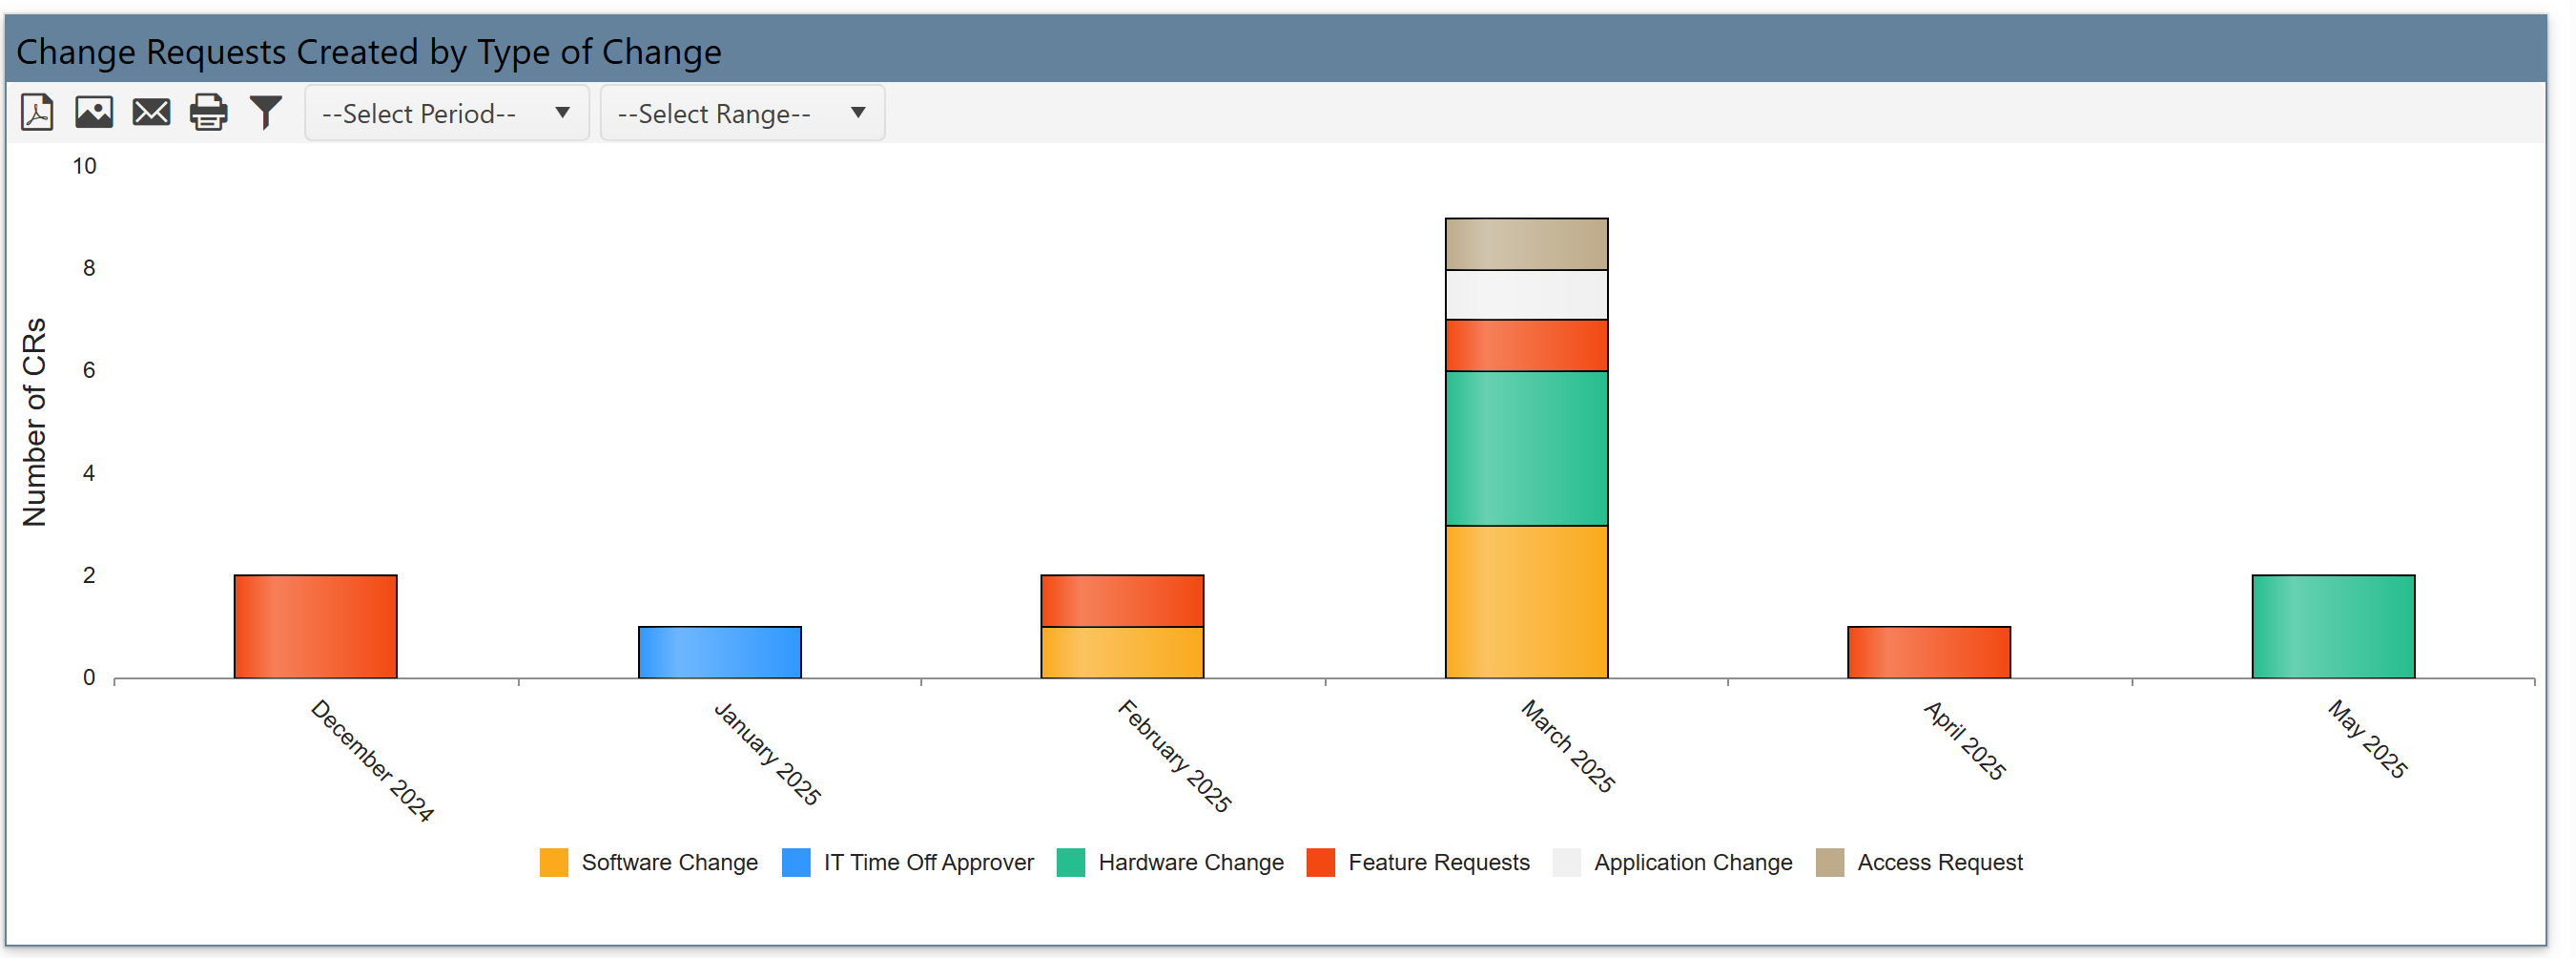
Change Requests Created by Type of Change
•Shows how many CRs were created, grouped by change type such as:
oSoftware Change
oFeature Request
oHardware Change
oApplication Change
oAccess Request
•It helps understand what kinds of changes are requested most frequently.
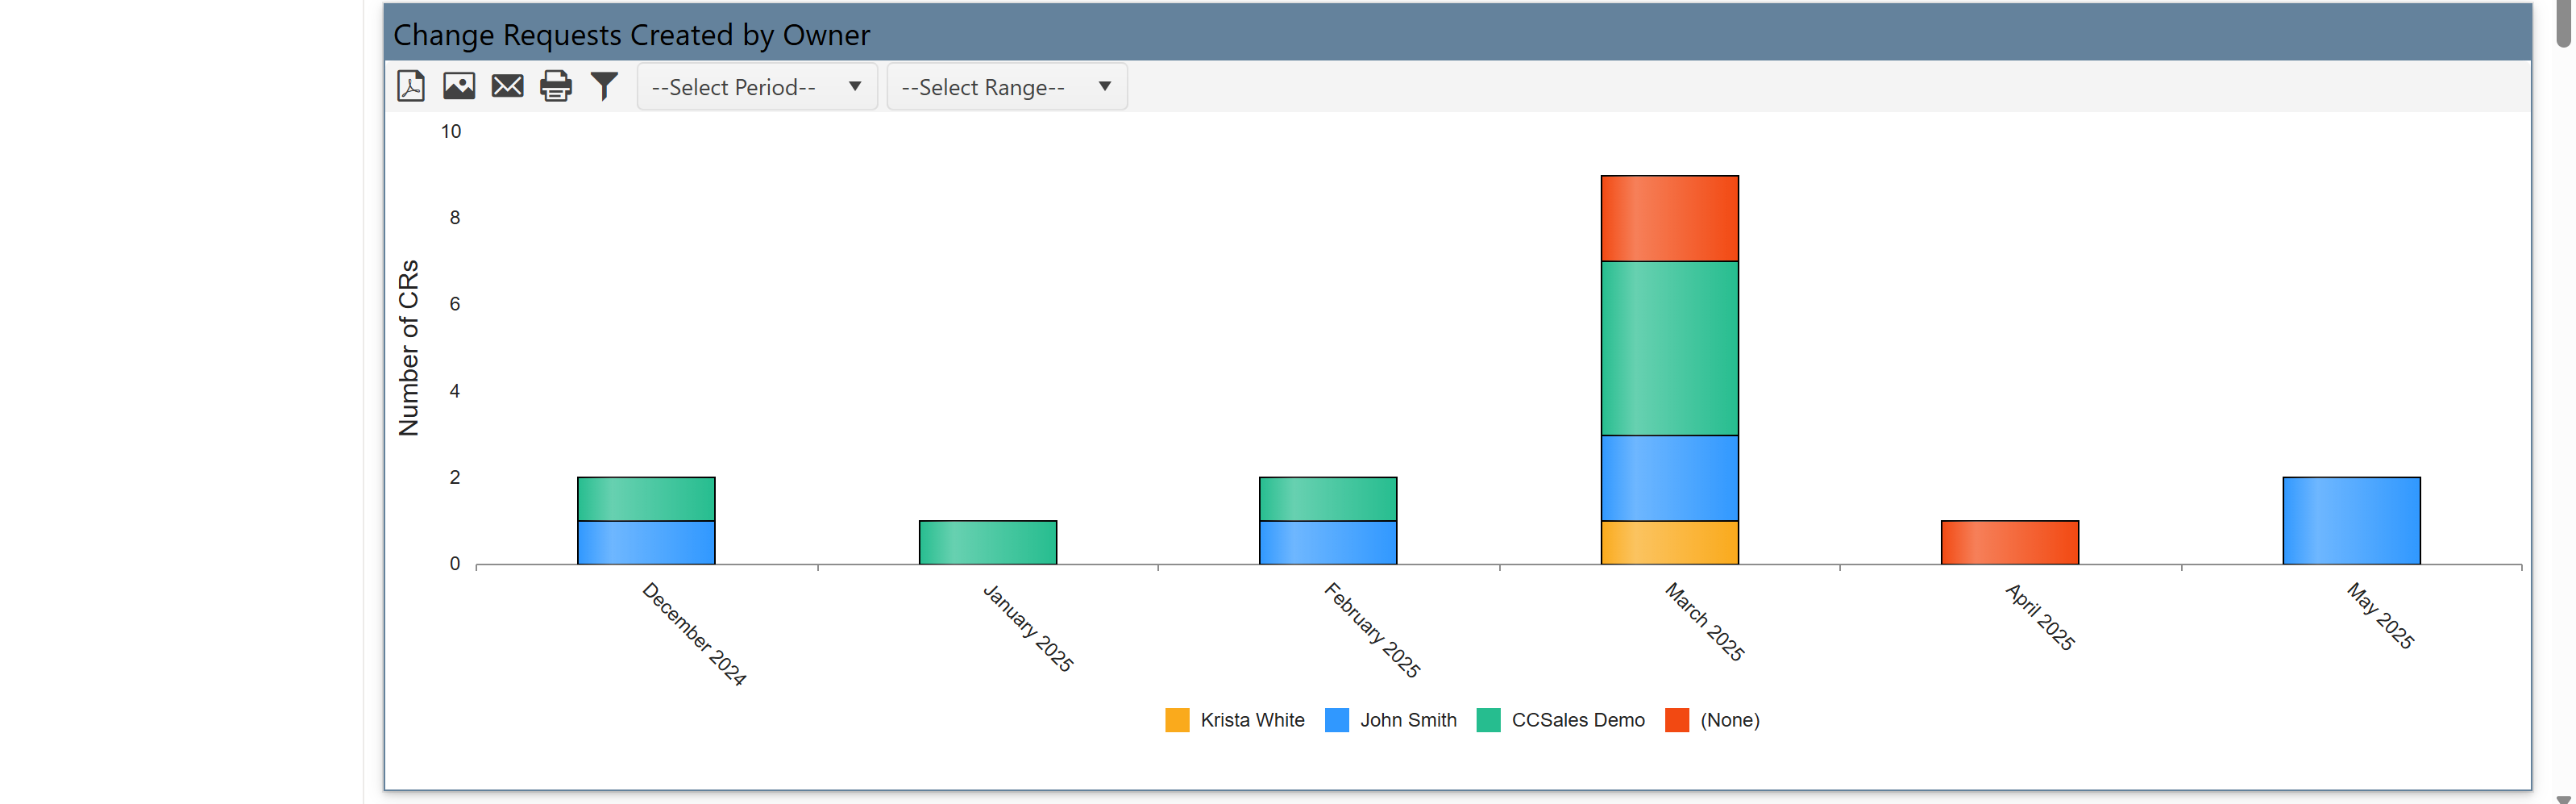
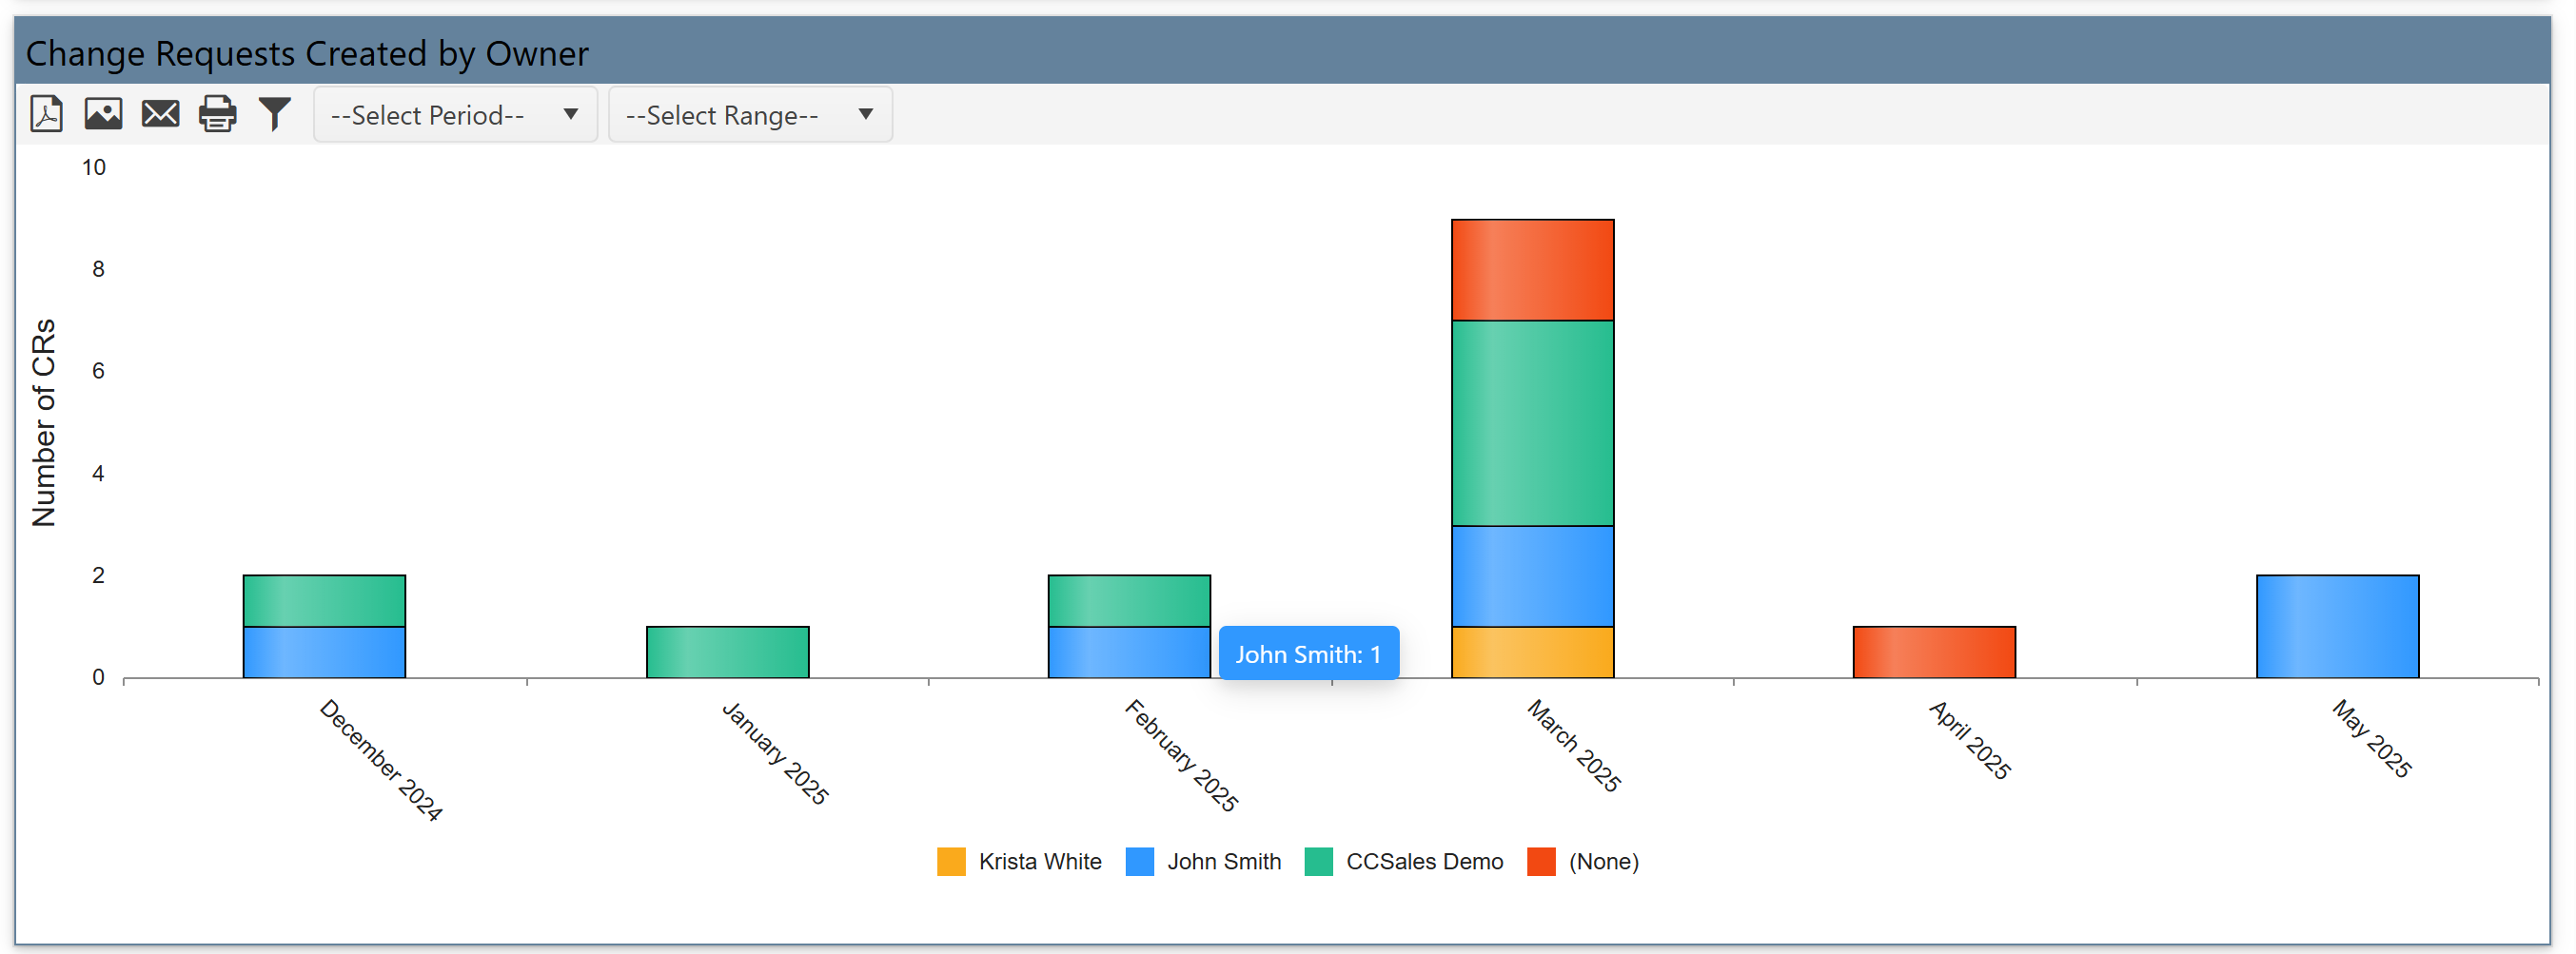
Change Requests Created by Owner
•Shows how many CRs were created by each owner (e.g., Krista White, John Smith).
•Each bar shows volume by owner and is stacked by change type.
•It tracks team members handling CR creation and workload distribution.
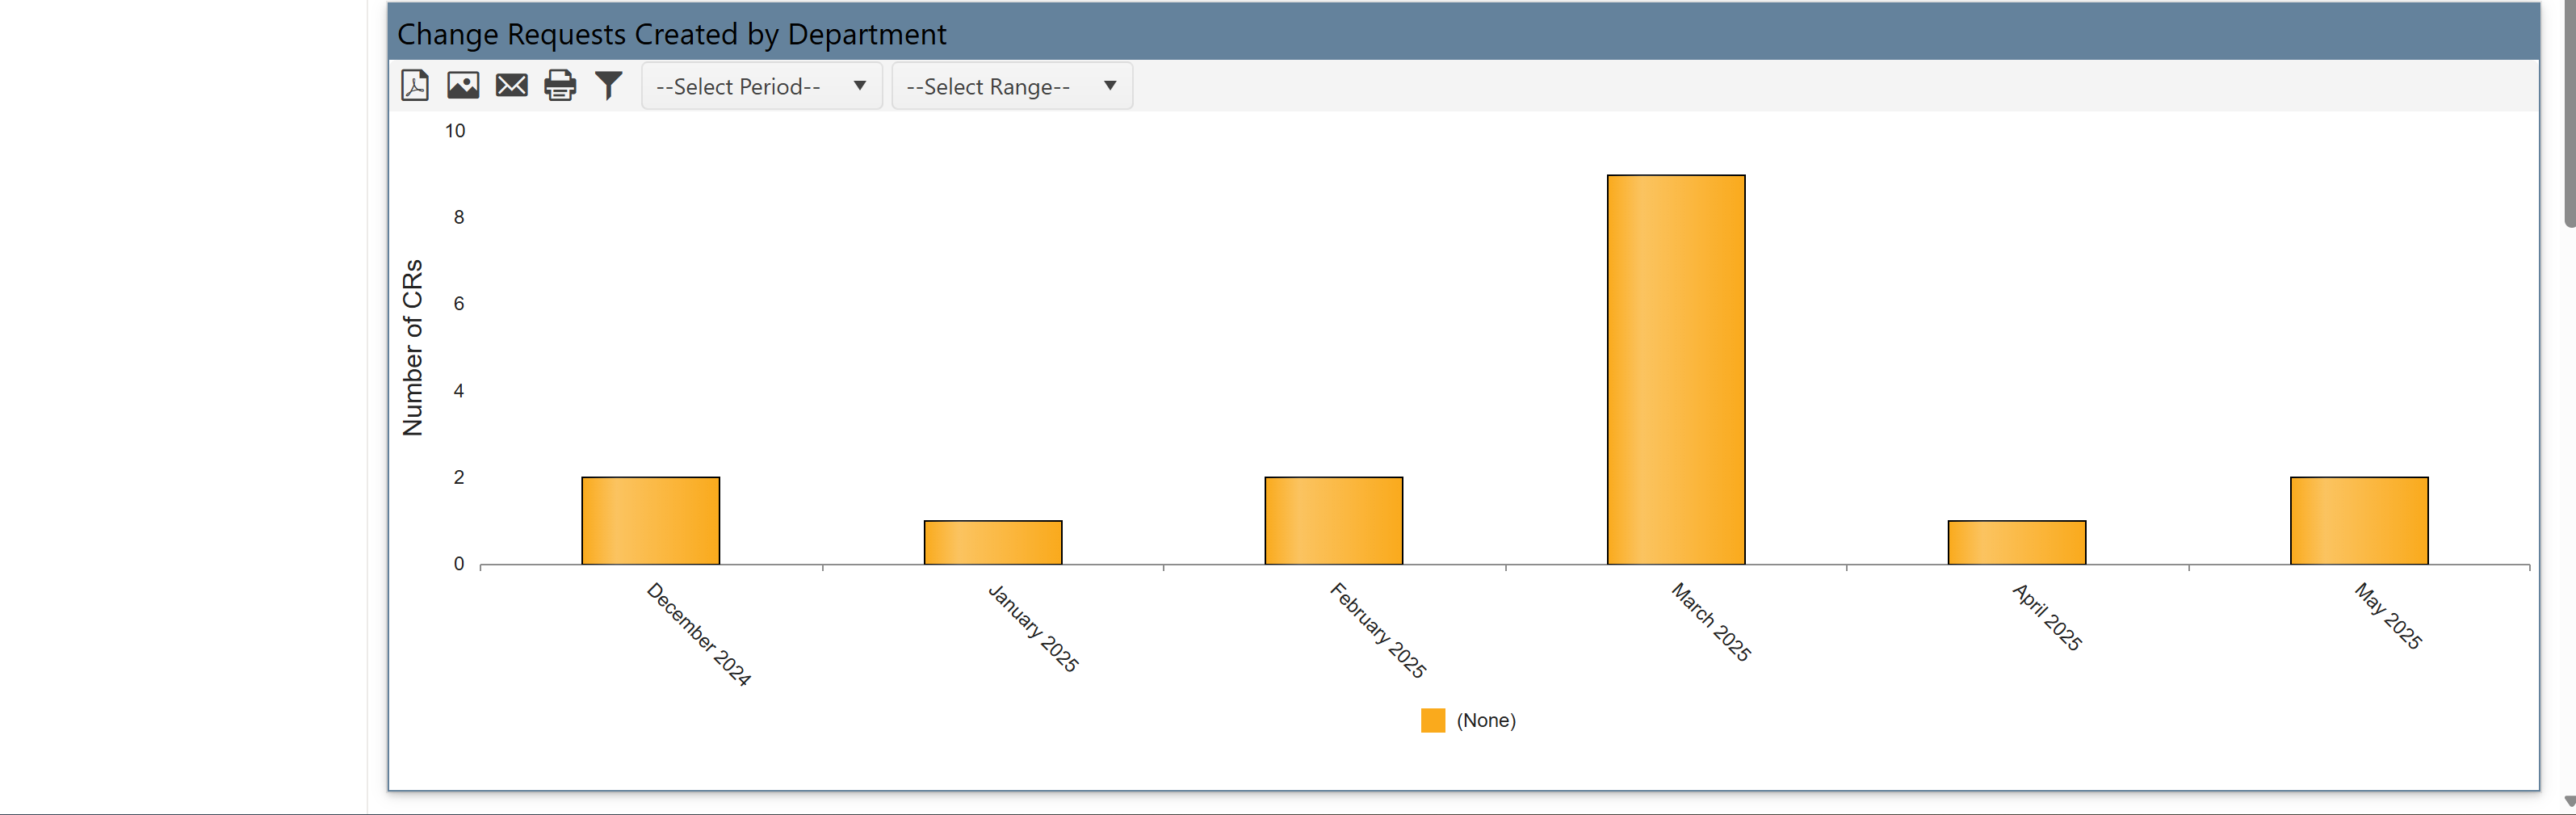
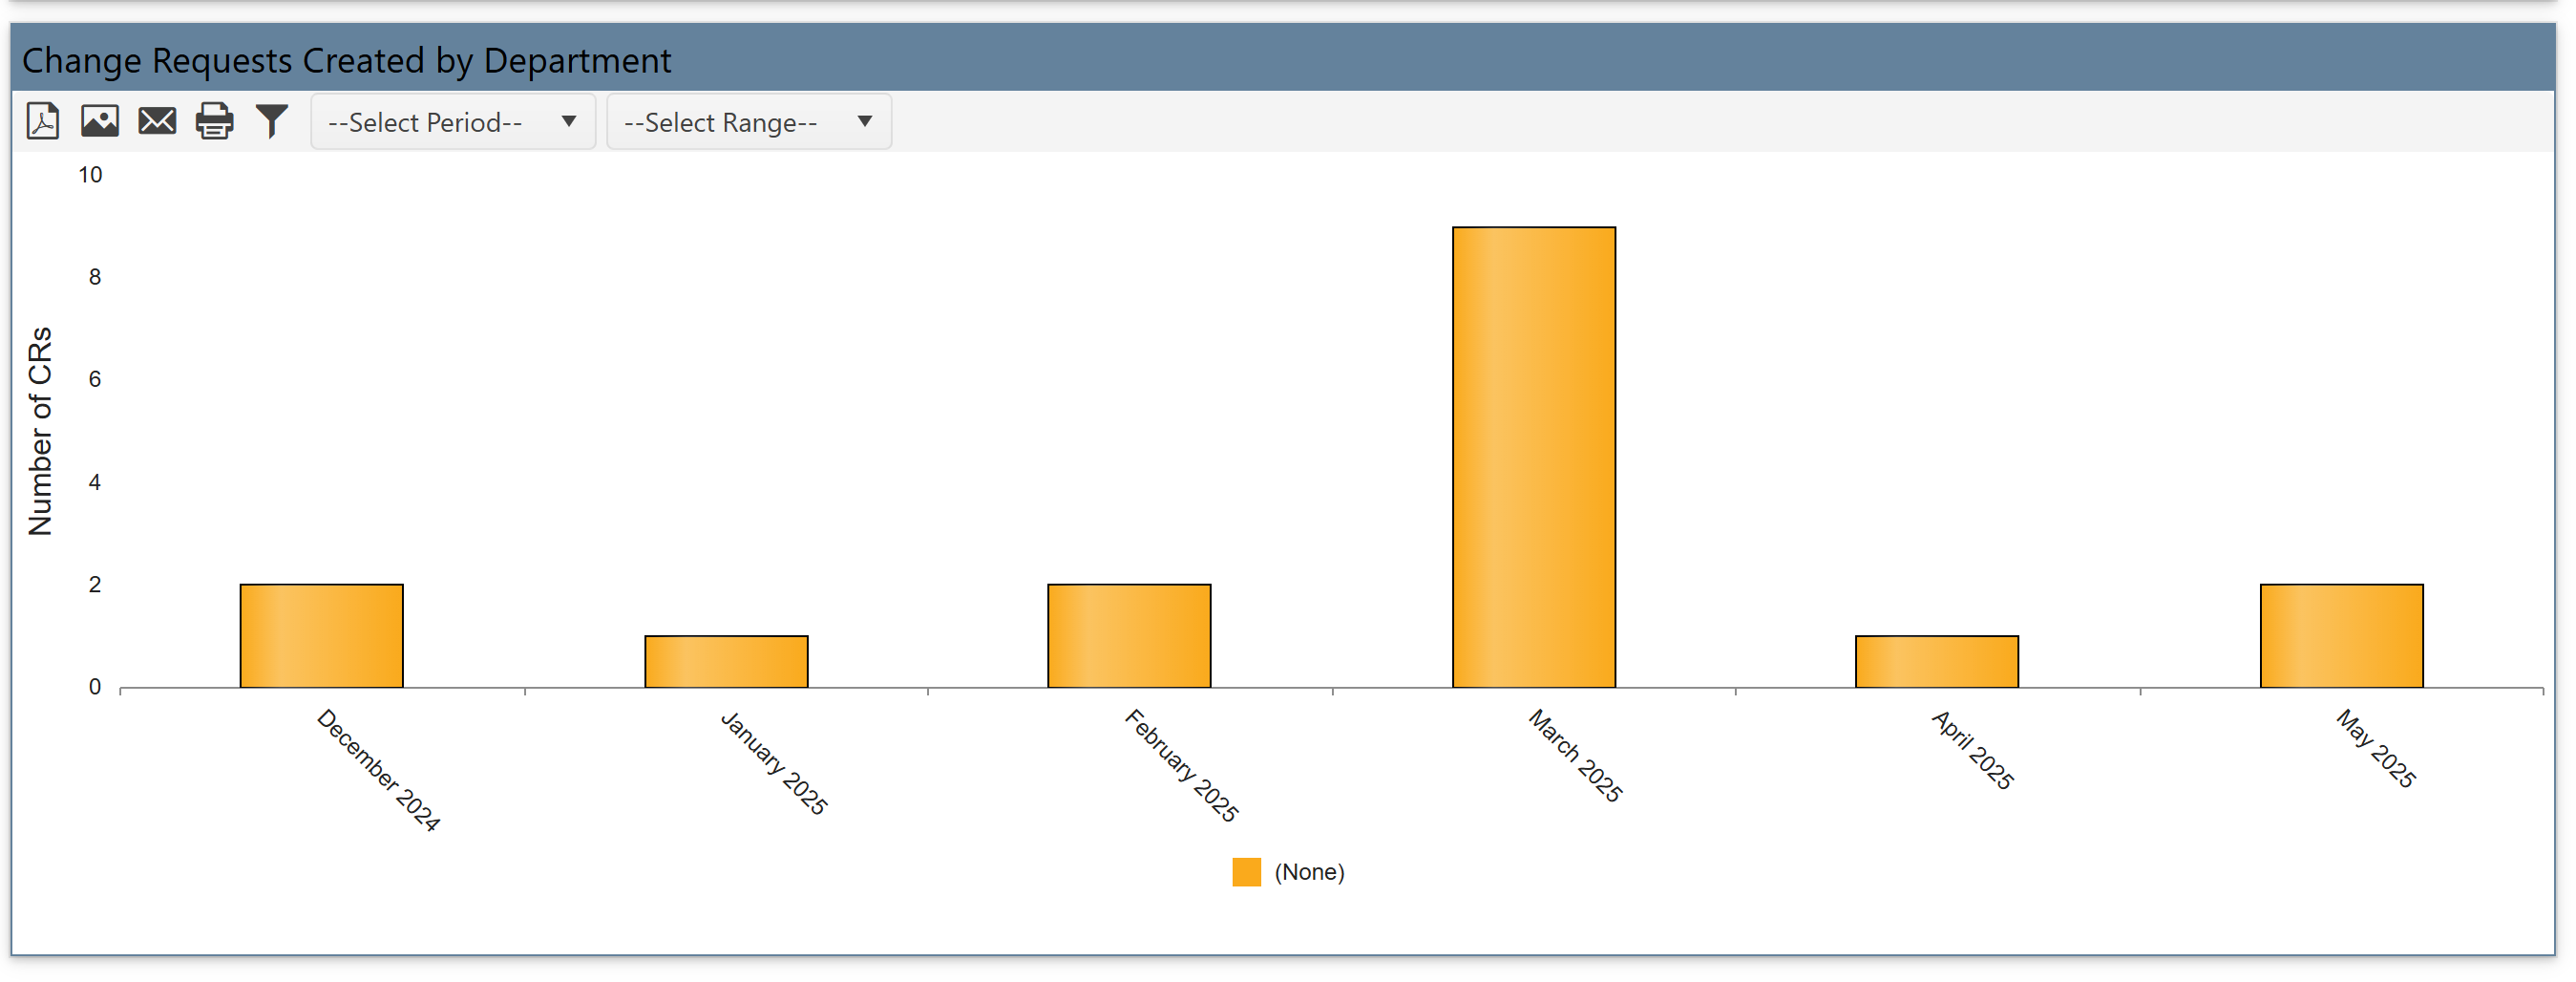
Change Requests Created by Department
•Displays how many CRs were created by each department (e.g., Sales, IT).
•Simple bar chart not stacked.
•It helps identify which departments are driving most changes.
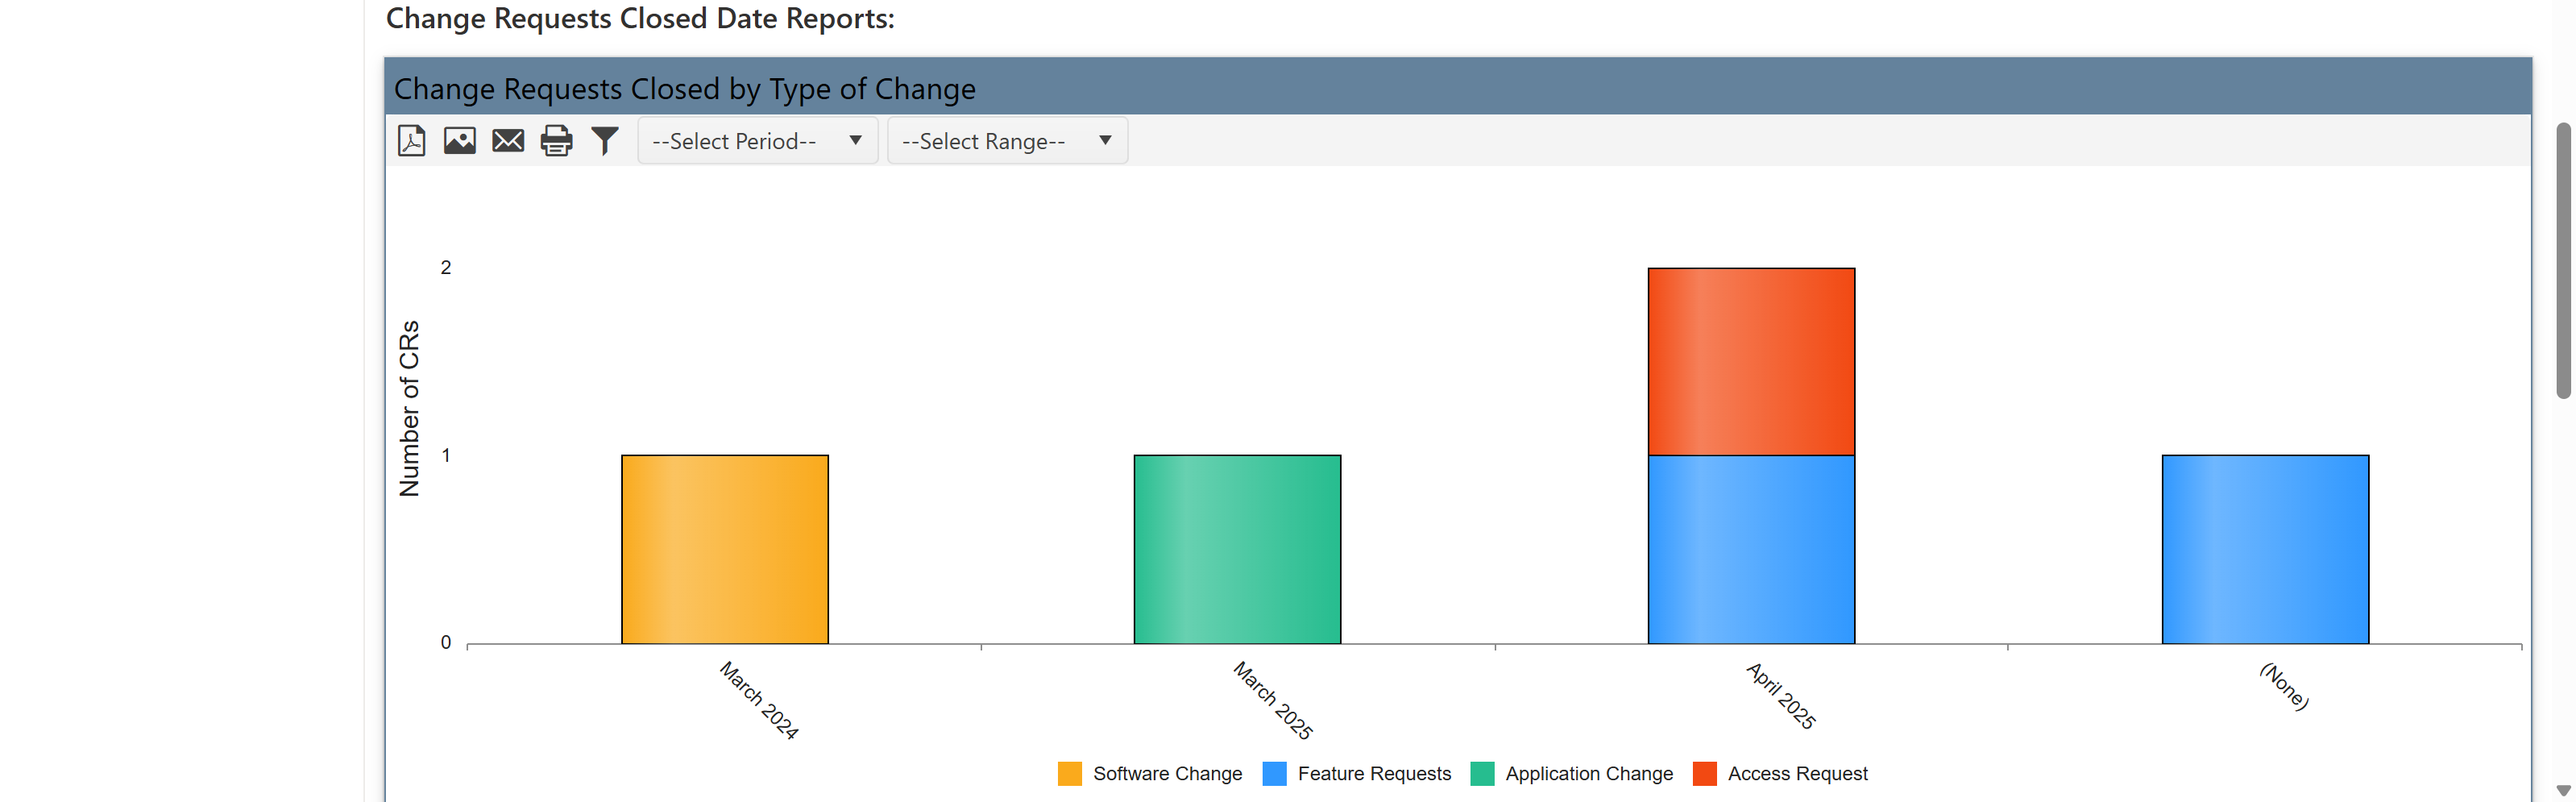
Change Requests Closed Date Reports
These reports show how many Change Requests were closed in the selected period.
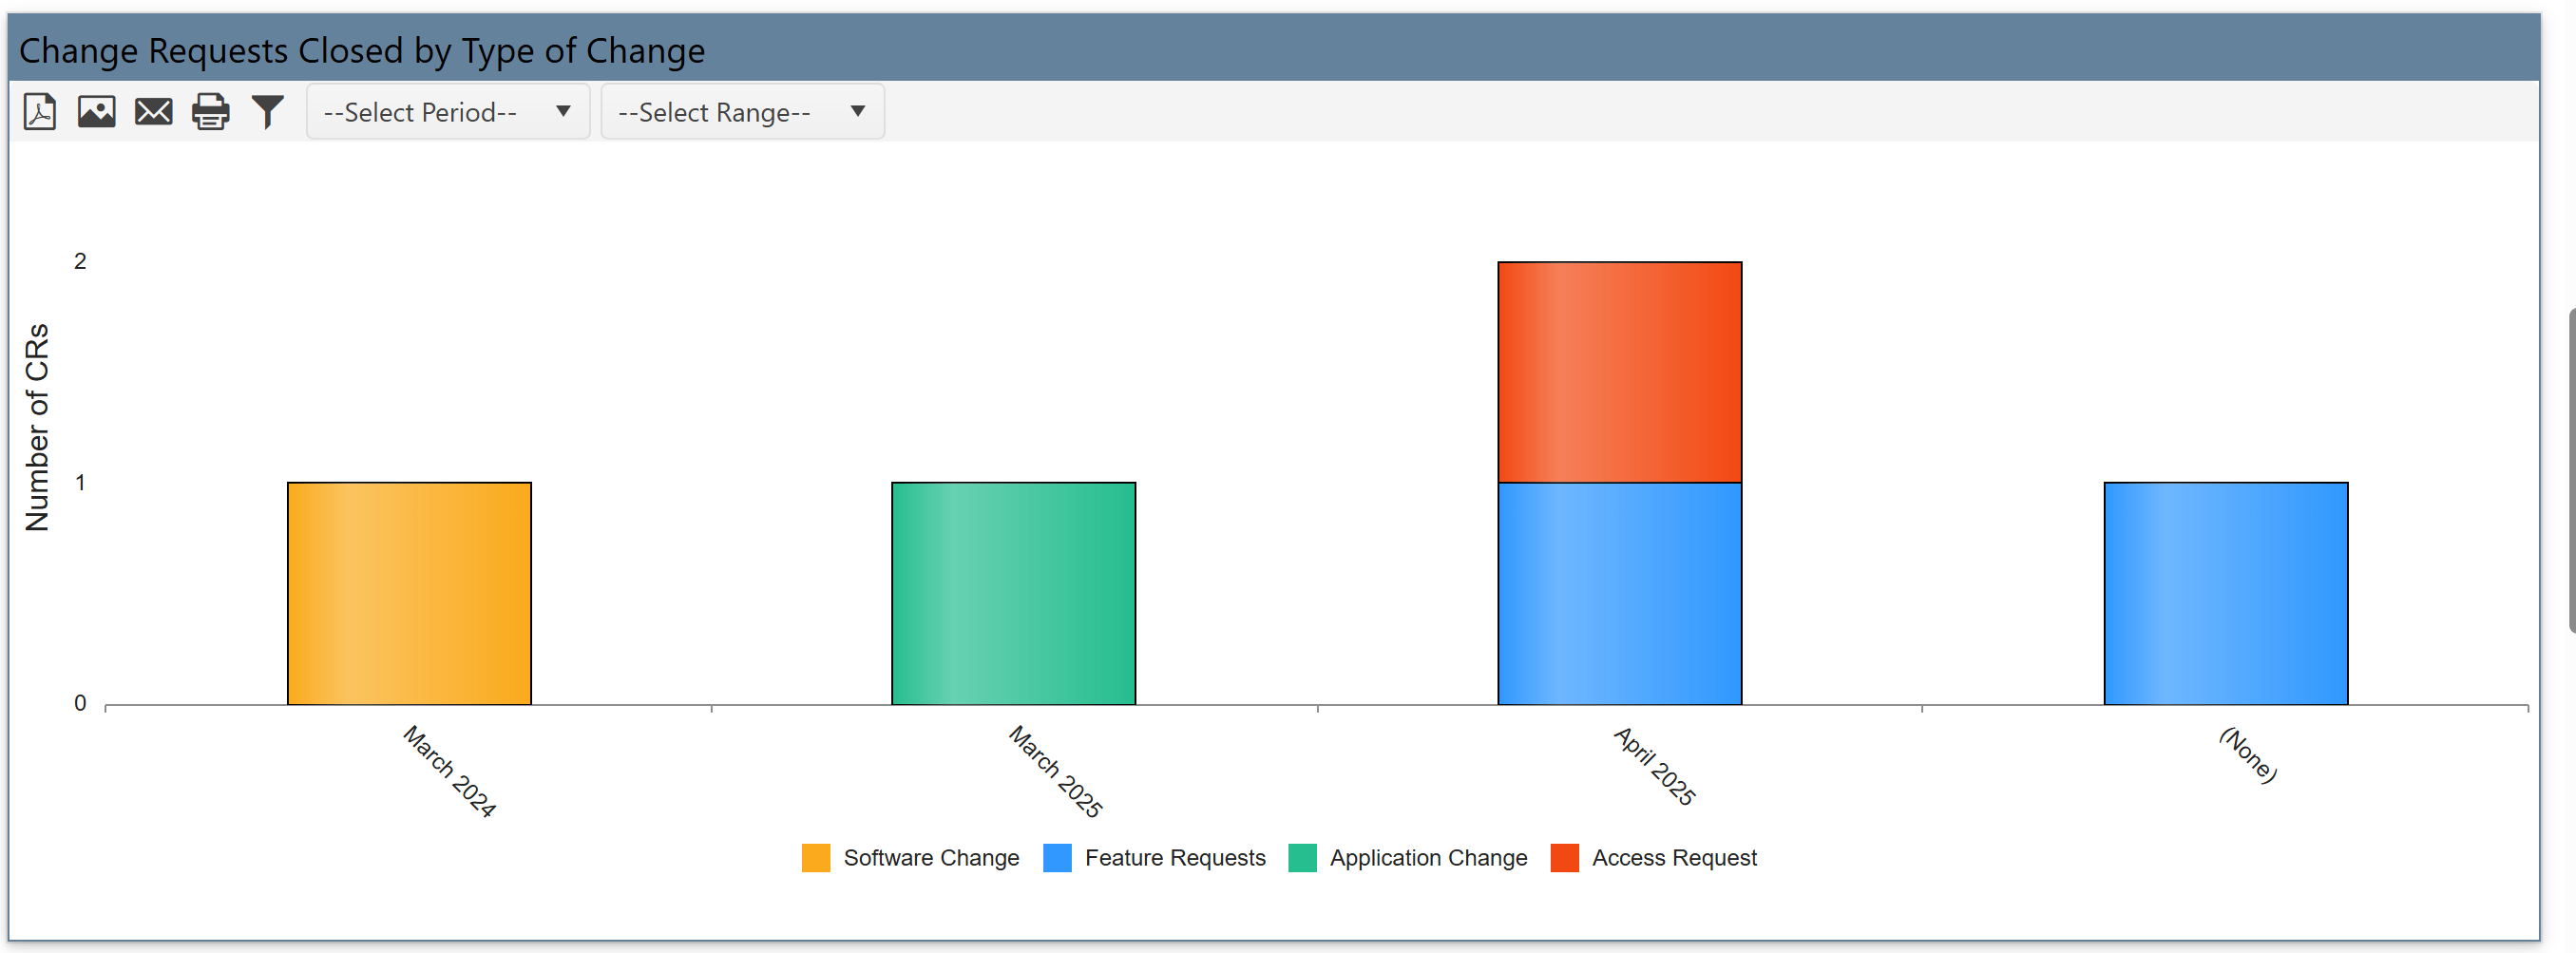
Change Requests Closed by Type of Change
•Shows how many CRs were closed, grouped by type of change (same types as creation report).
•Color-coded stacked bars show distribution across change types.
•It compare with creation data to see which types are completed effectively.
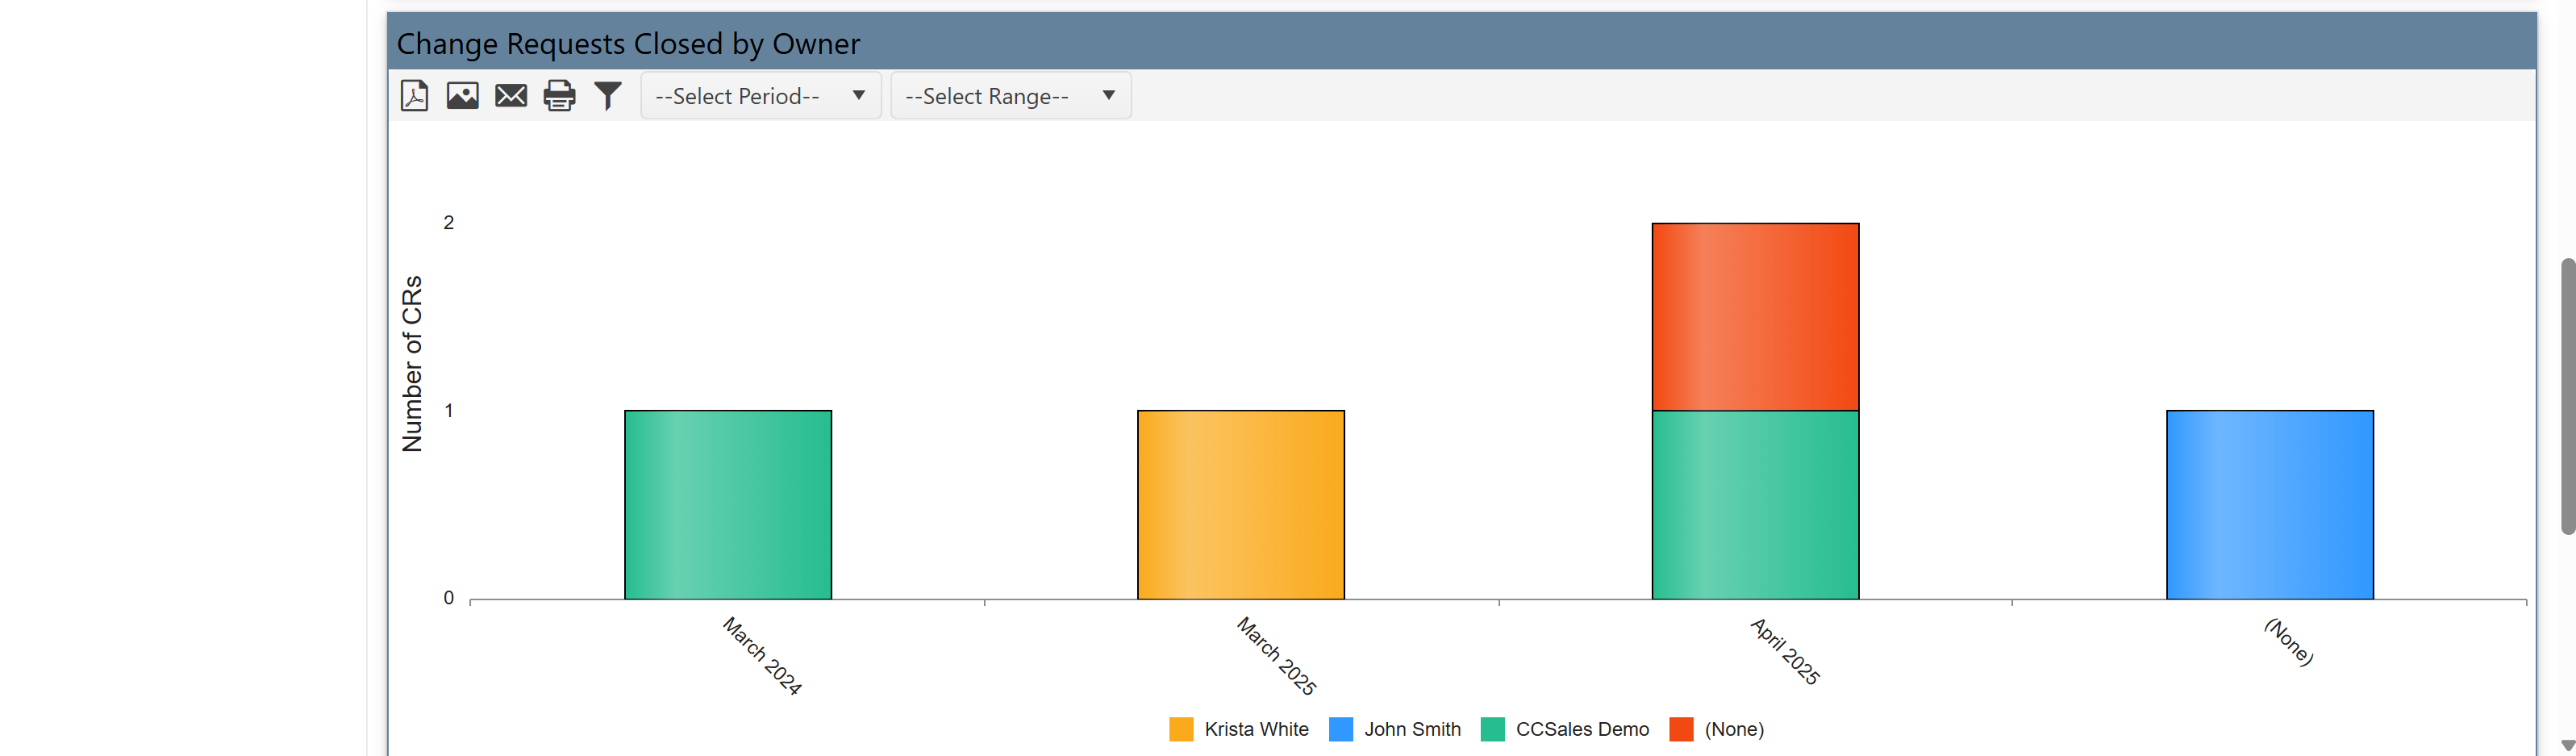
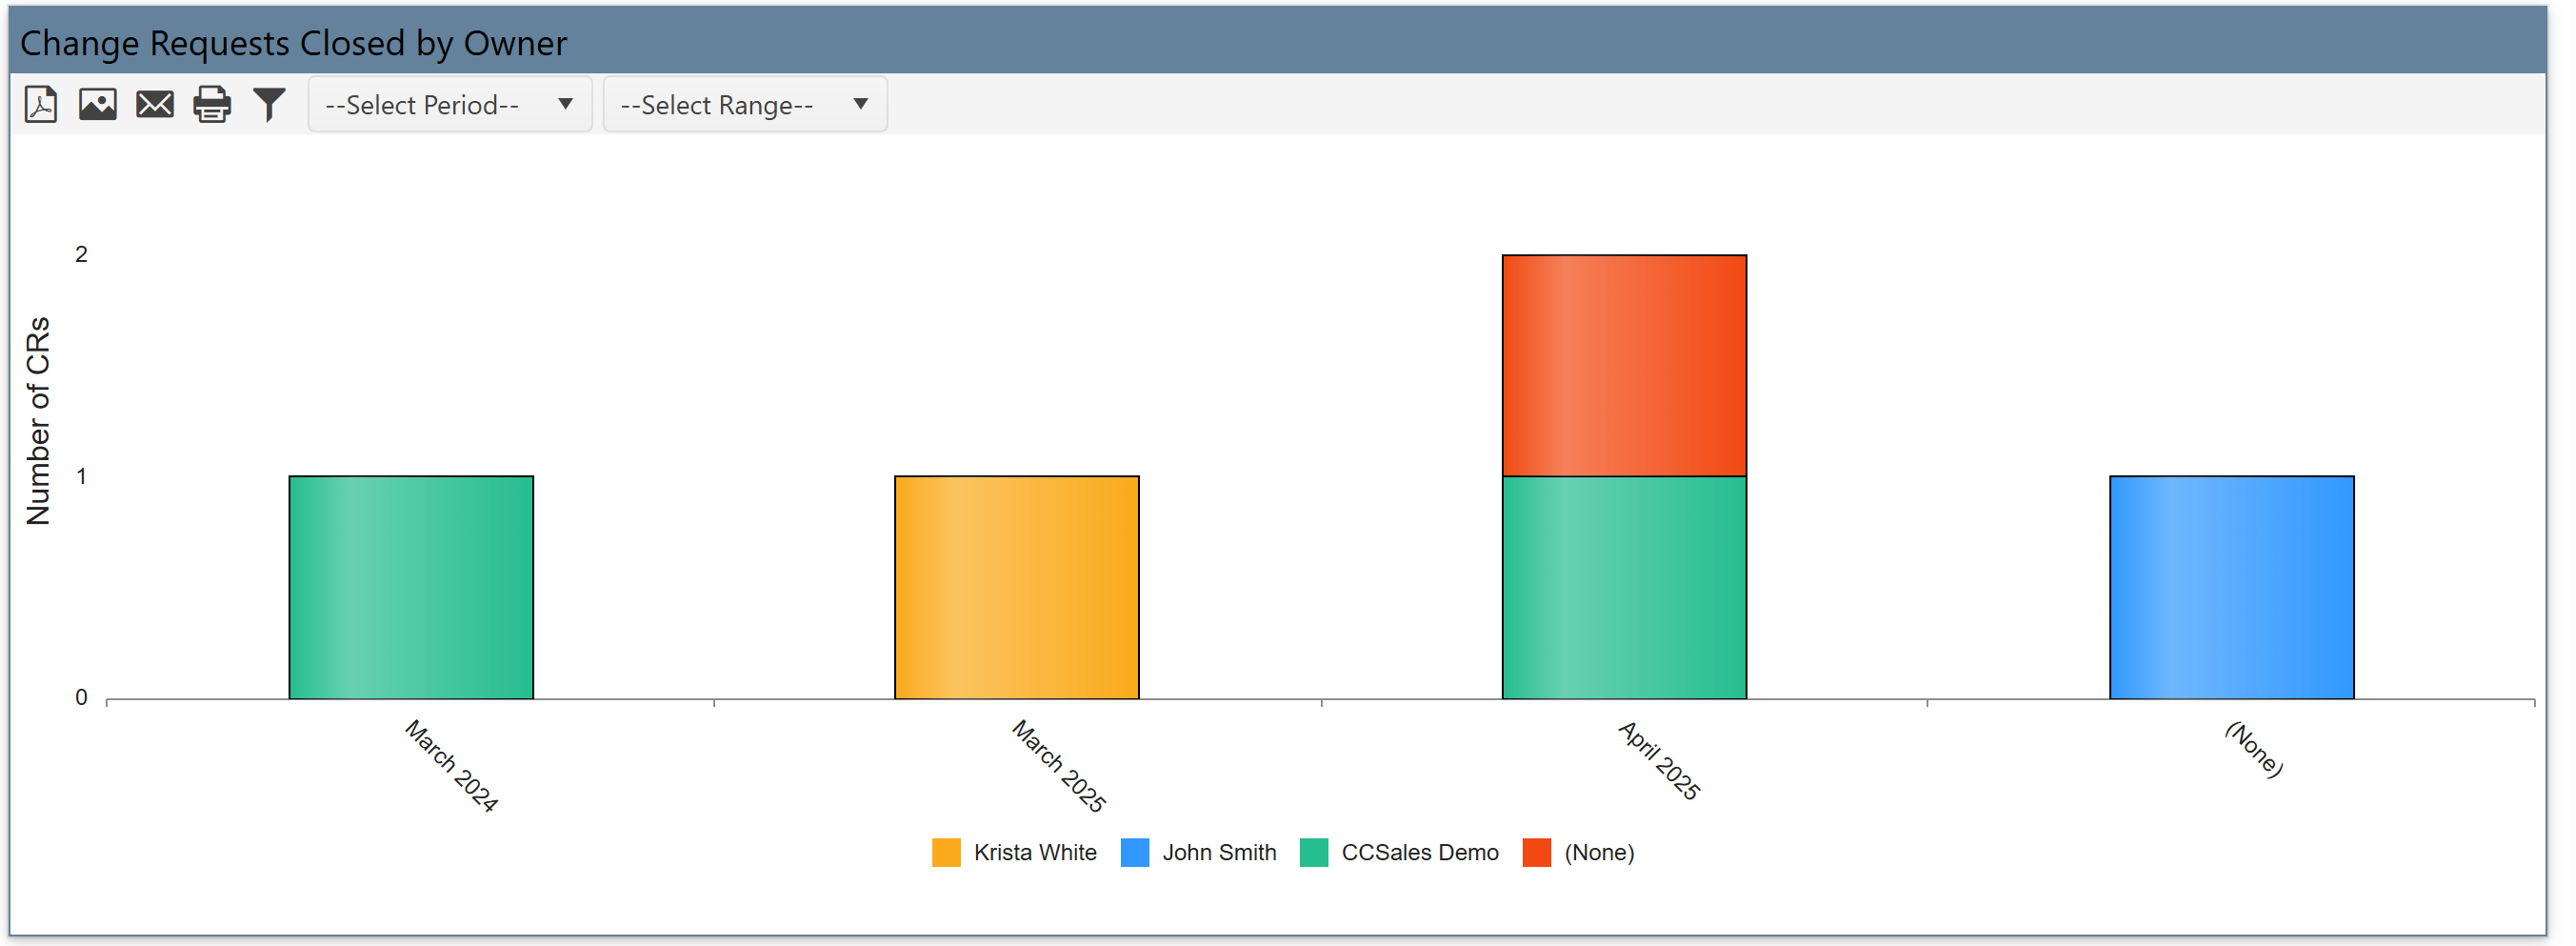
Change Requests Closed by Owner
•Displays how many CRs each owner closed.
•Bars show owner-wise closure numbers and are stacked by change type.
•It helps measure performance or involvement of each team member.

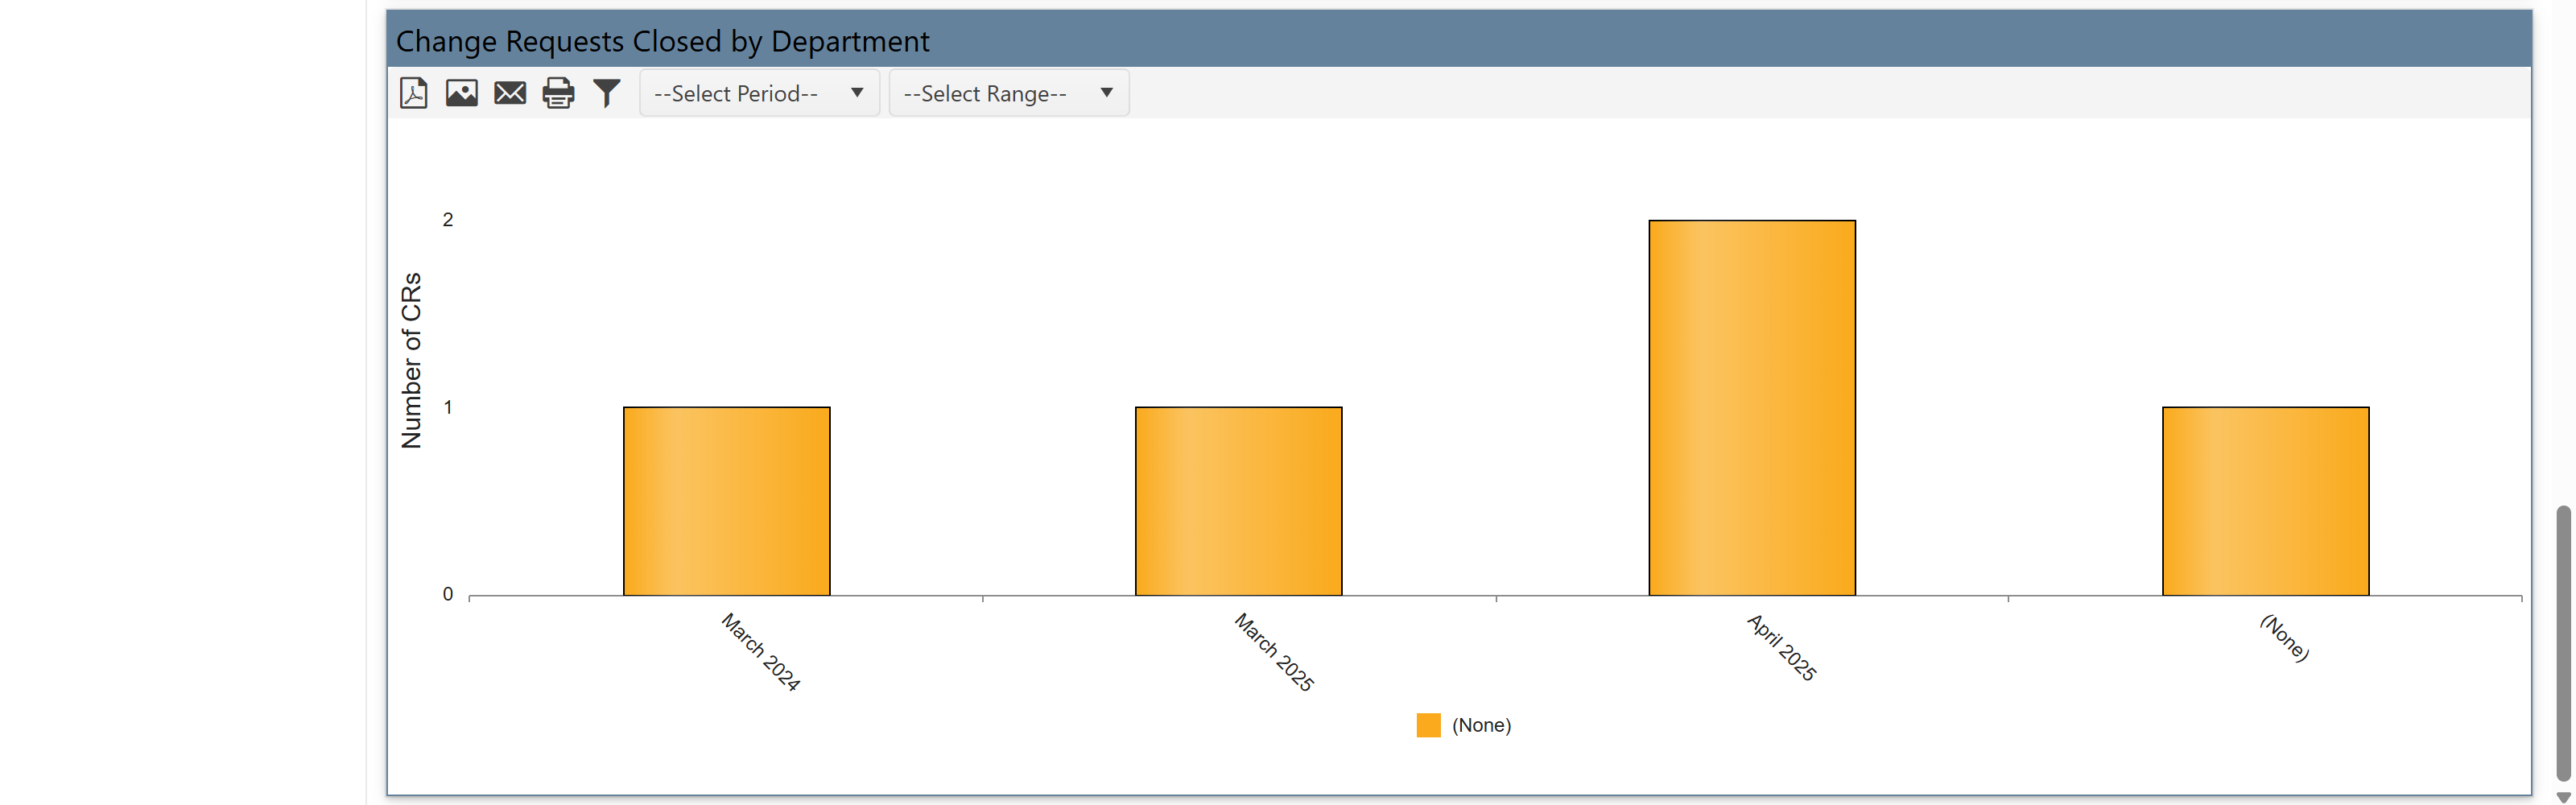
6. Change Requests Closed by Department
•Shows number of CRs closed, grouped by department.
• Simple bar chart.
• It compare CR activity (open vs closed) by department for accountability and planning.
•You can filter all reports by:
oDate range (e.g., Current or Previous period)
oTime frame (Month, Quarter, Year)
•Reports can be grouped by:
oChange Type
oOwner
oDepartment
•Choose between Created Date or Closed Date for tracking.
This reporting dashboard for Change Requests helps you:
•Monitor CR trends by type, owner, and department.
•Compare how many CRs are opened vs. resolved over time.
•Filter data easily using dropdowns.
•Identify workload, trends, and bottlenecks across teams.