Reports can be displayed in a Dashboard. This can be a Classic UI page, a Modern UI Page, or one of our NITRO Portals.
Related Topic: Add a Report or Report Center to a Page
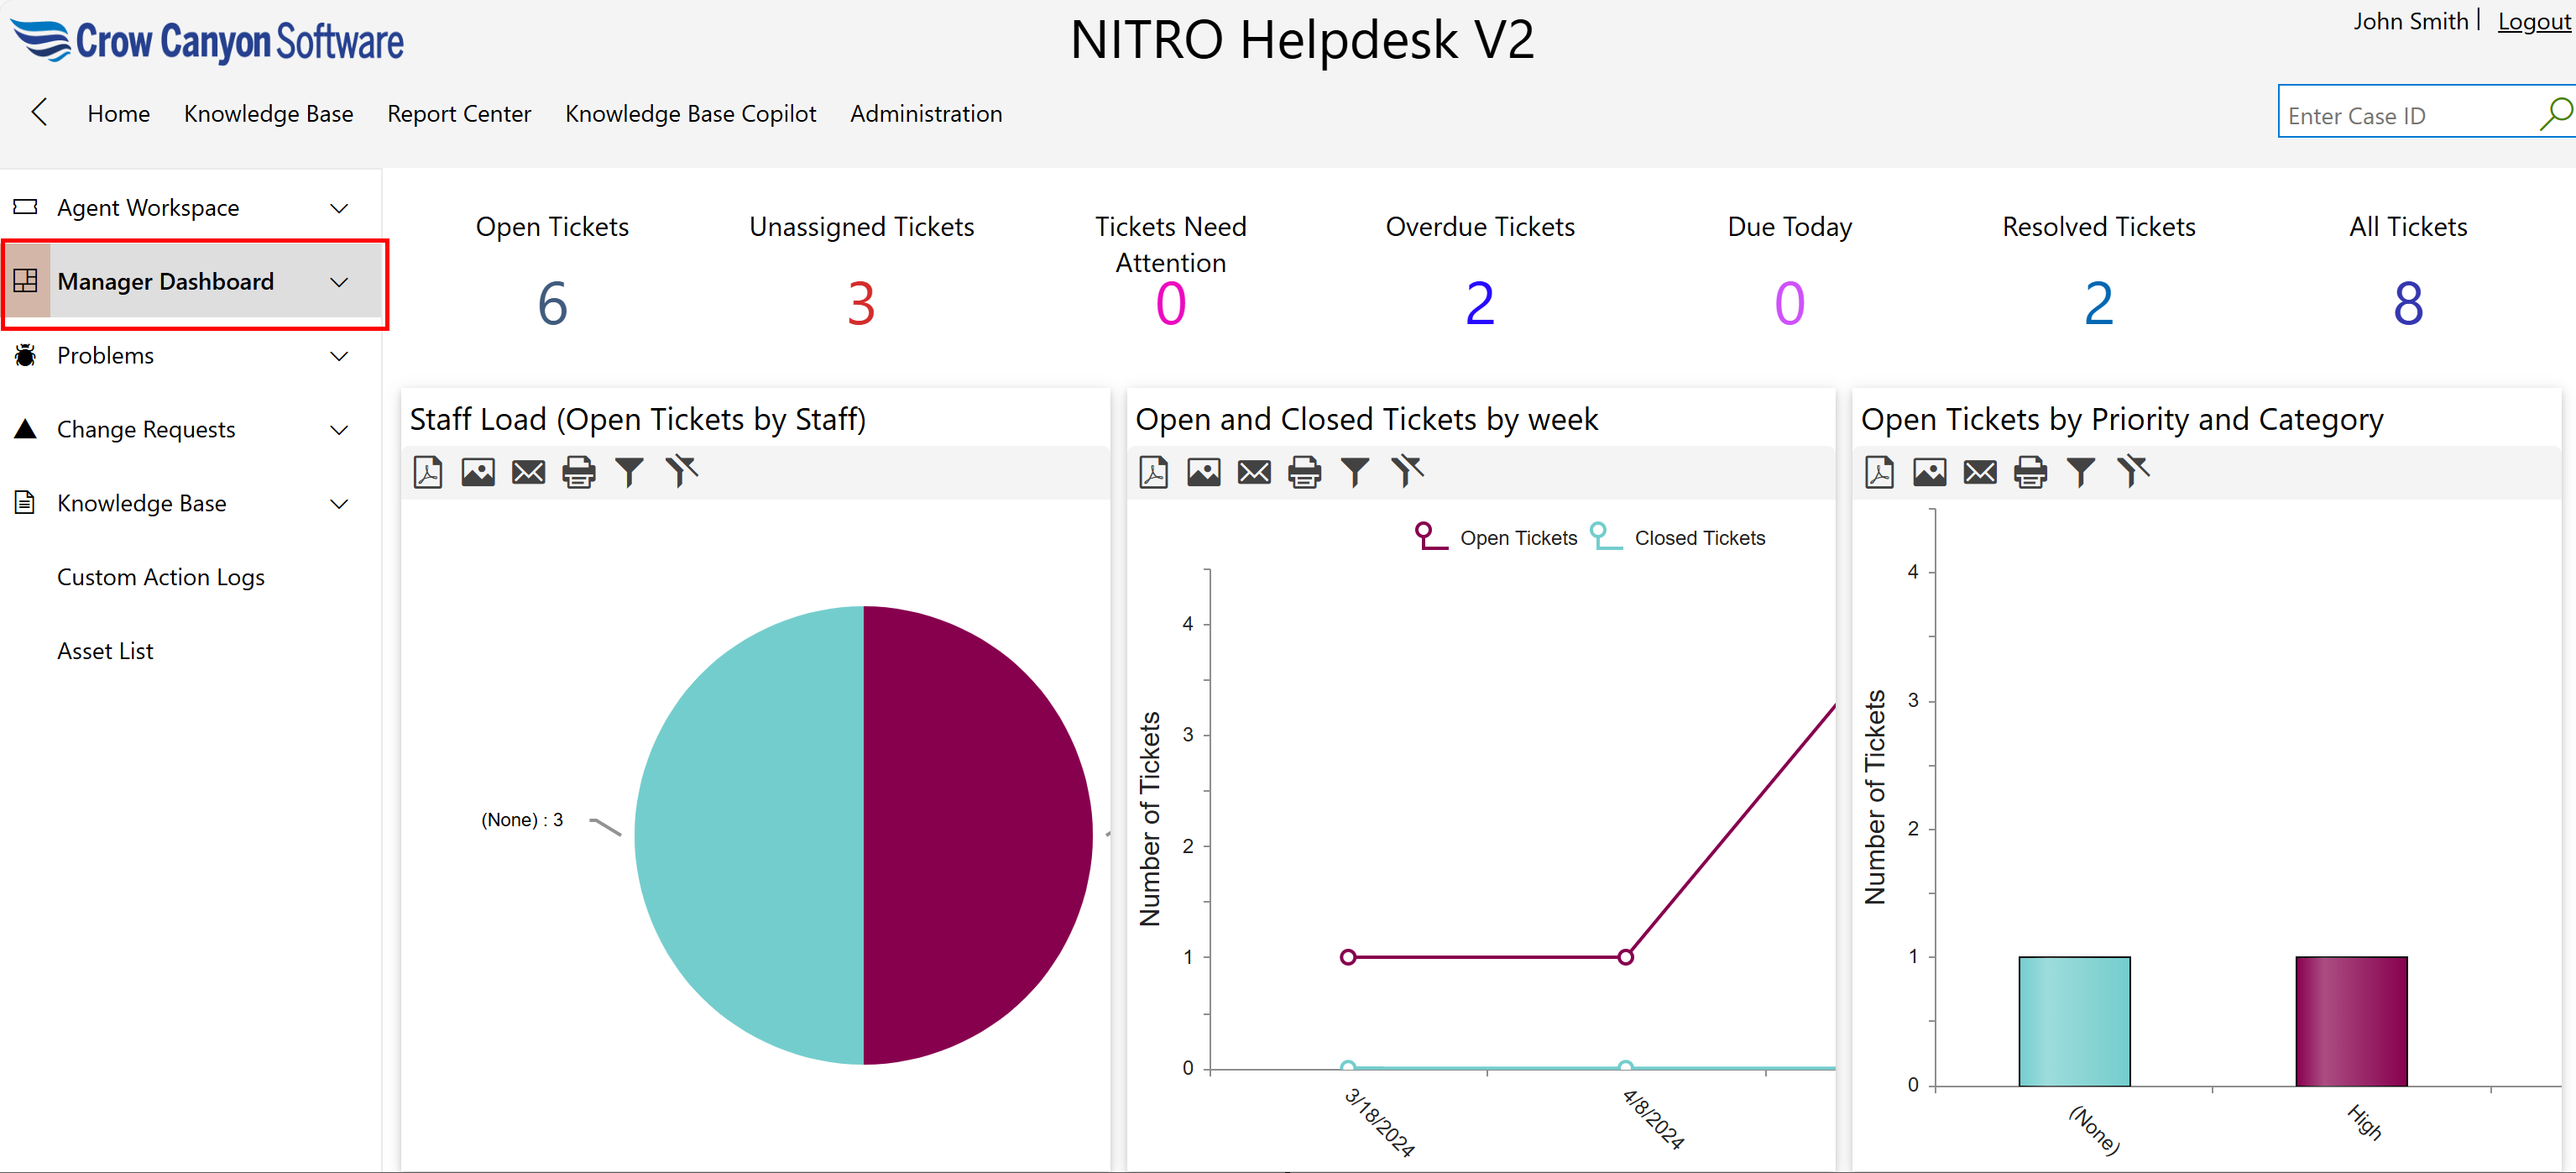
Once the Report or multiple Reports are on a page, it looks something like this, with a range of options in each report's toolbar:
Report Toolbar
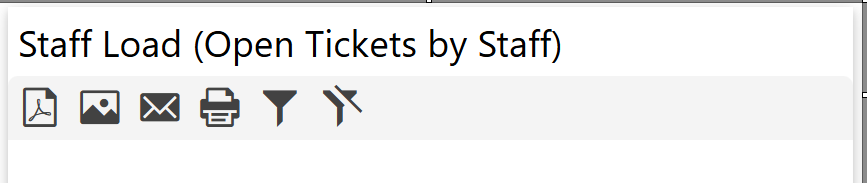
 PDF -- creates a PDF file of the report PDF -- creates a PDF file of the report |
 Image -- creates an image (.png file) of the report Image -- creates an image (.png file) of the report |
 Email - opens a "Send Email" box with options to set the TO, Subject, and Body. The report can be attached as either an image or a PDF. Email - opens a "Send Email" box with options to set the TO, Subject, and Body. The report can be attached as either an image or a PDF. |
 Print -- prints the report Print -- prints the report |
 Report Filter - filters the report in real-time, see below. The left icon opens the filter, the right icon removes the filter. Report Filter - filters the report in real-time, see below. The left icon opens the filter, the right icon removes the filter. |
Report Filter:
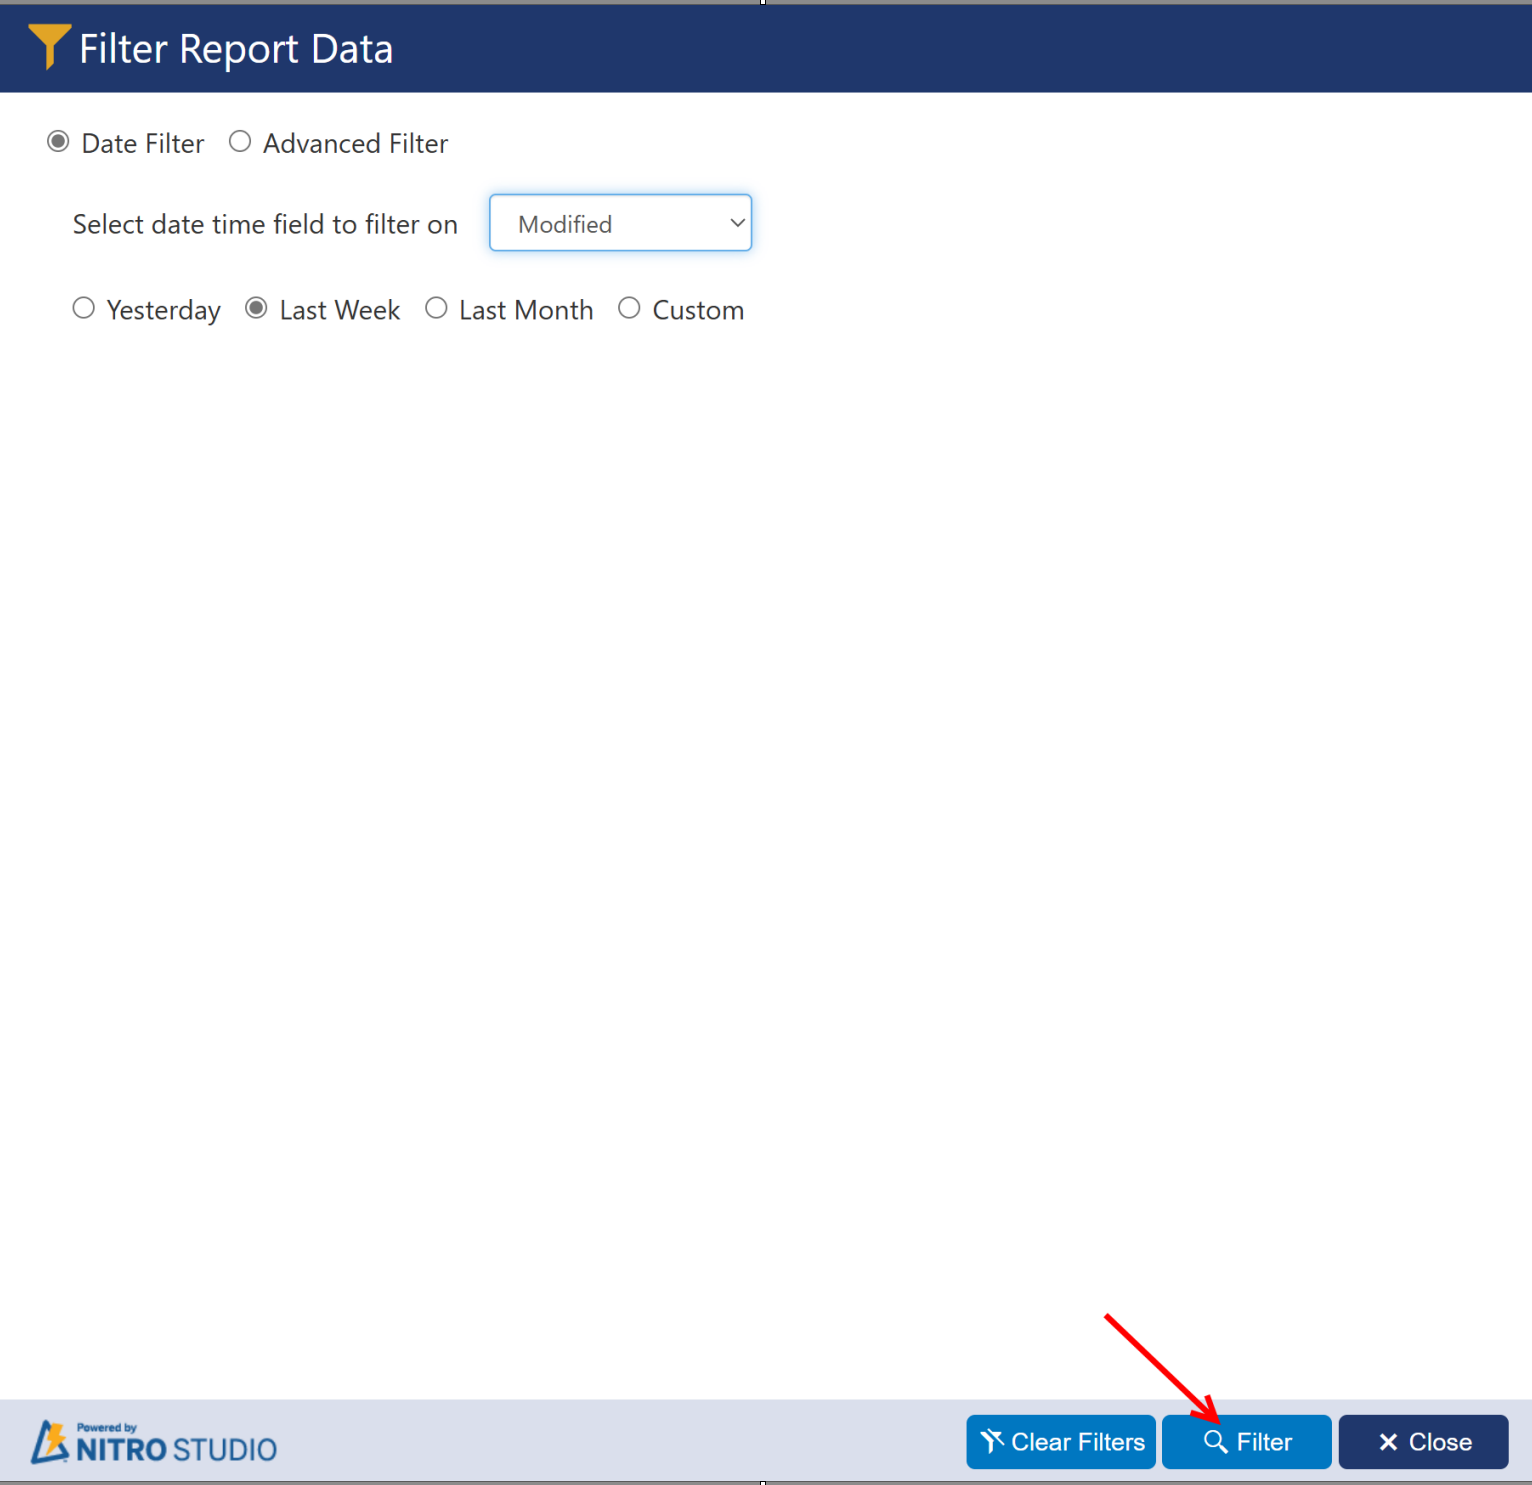
With this feature, you can filter the results by any date time field, as well as filter the results by any combination of filters of various columns, using the Advanced filter. Both of these can be a good alternative to configuring all of the filters in the SharePoint view that is used in the Report. One thing to note is that the filter(s) will have to be reset every time the page is reopened or re-loaded.
Date Filter
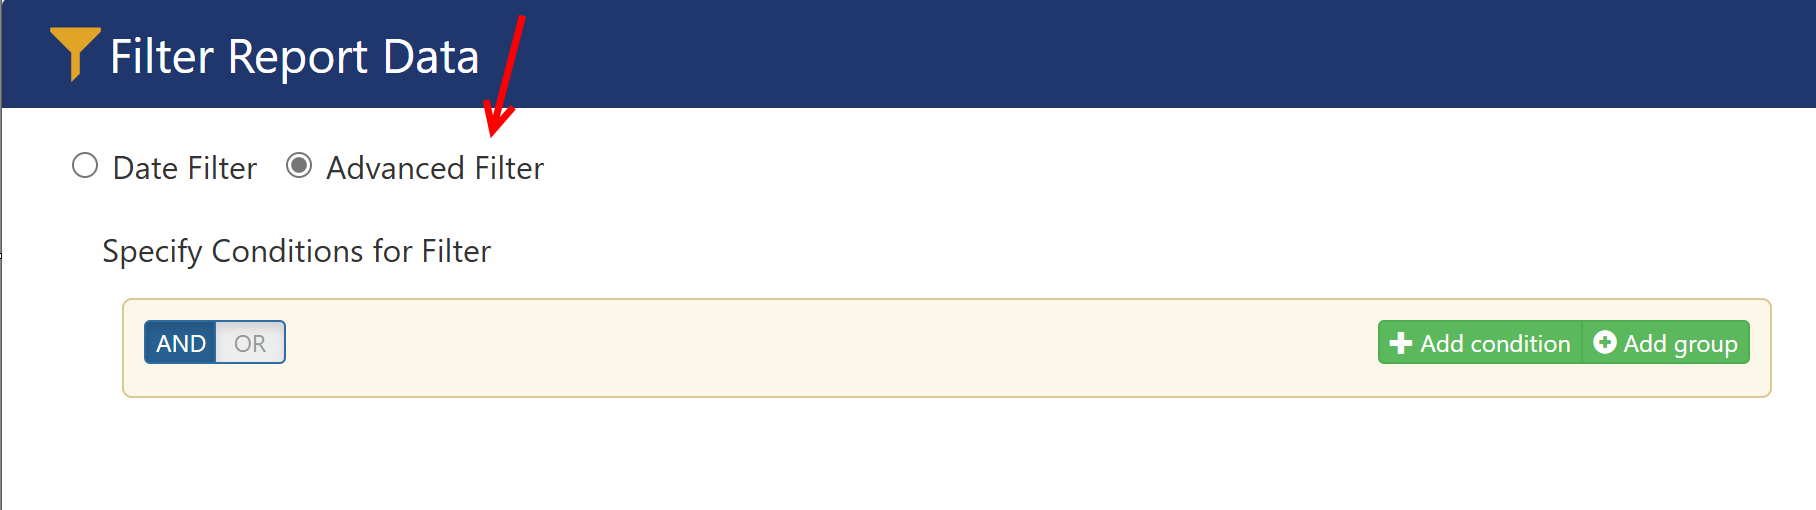
Advanced Filter - choose any set of Conditions in real-time