Reports can be a Table, Chart, or both. The colors of the table and charts can be changed by using Themes. Without a set theme, the Chart colors change randomly.
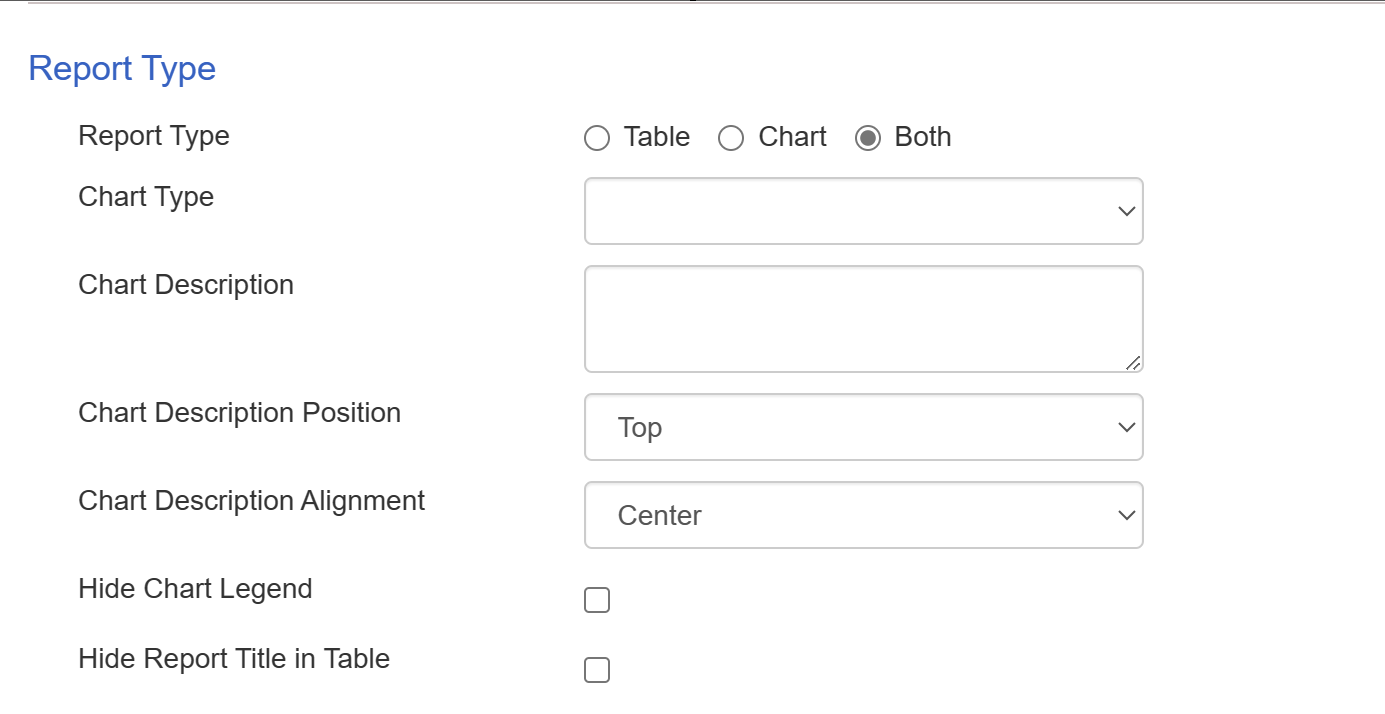
Chart Description - Enter the description of your chart and it will be displayed in the top-center of your report, below the title.
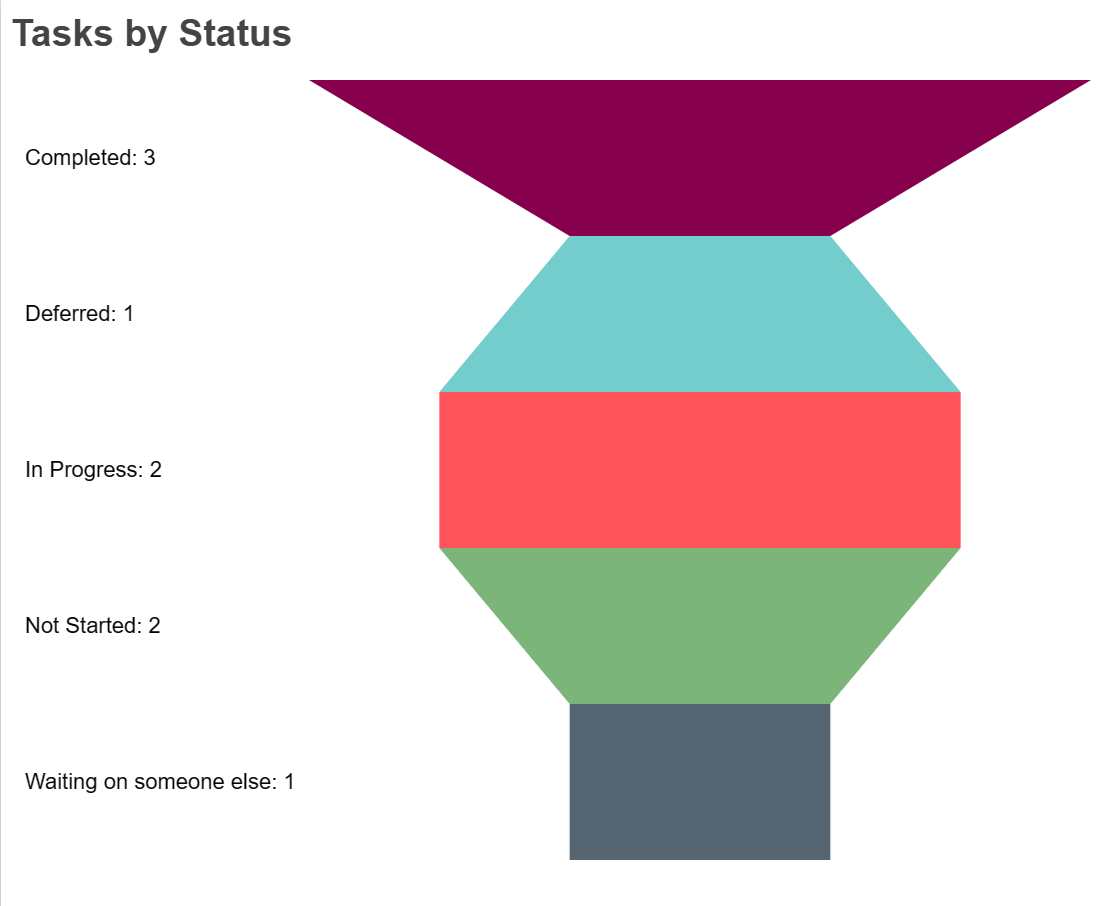
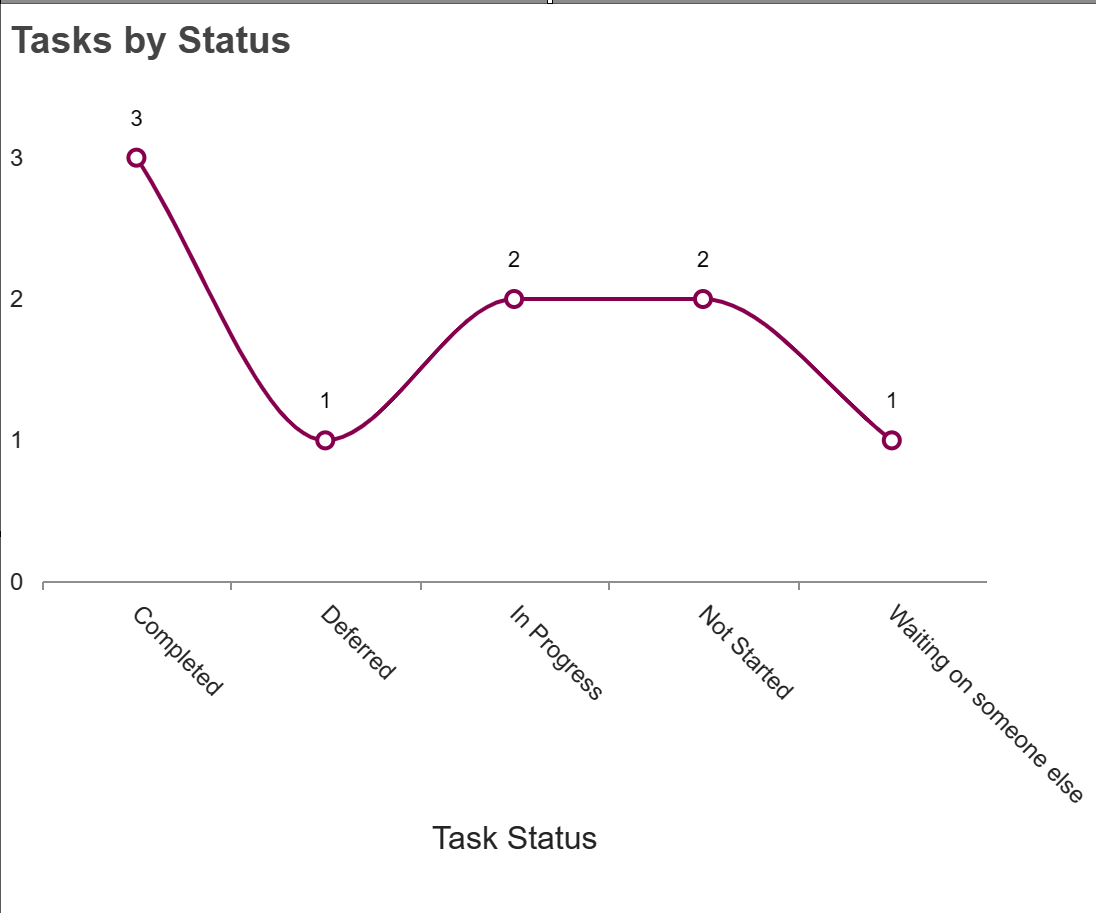
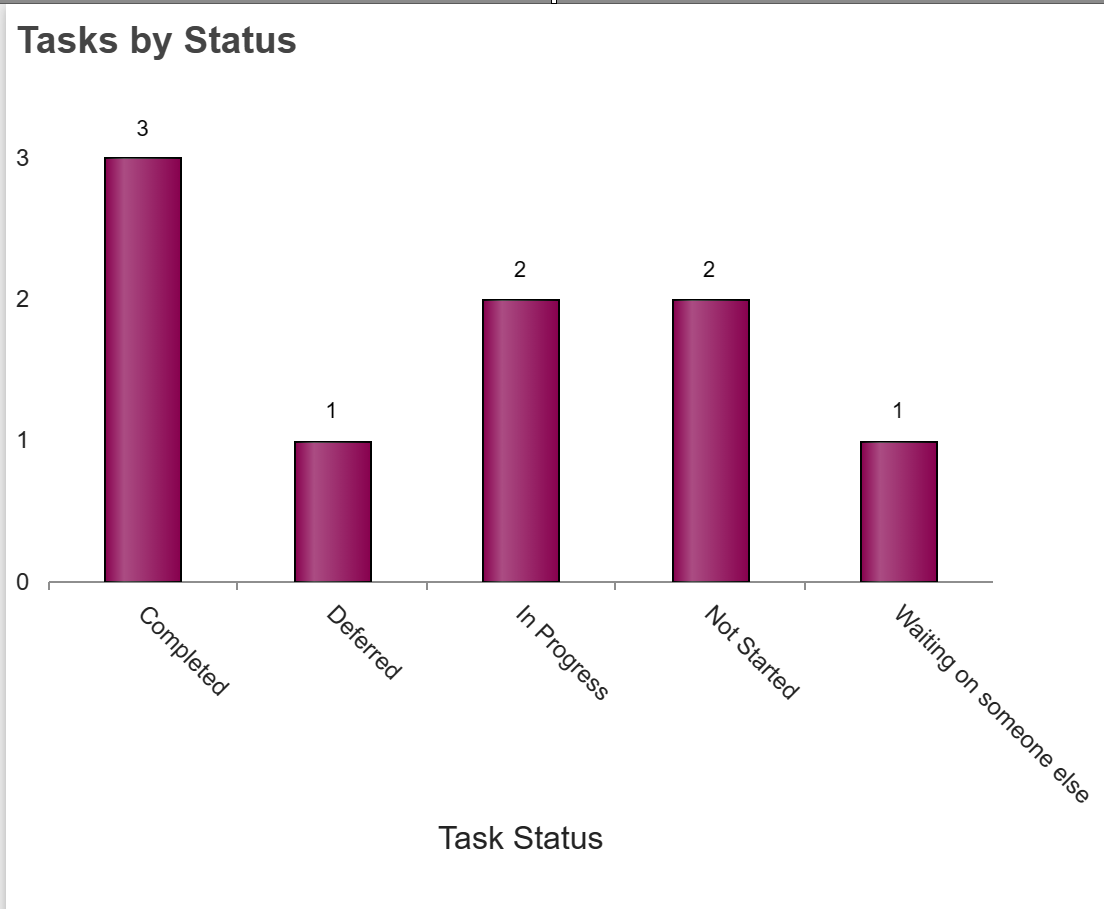
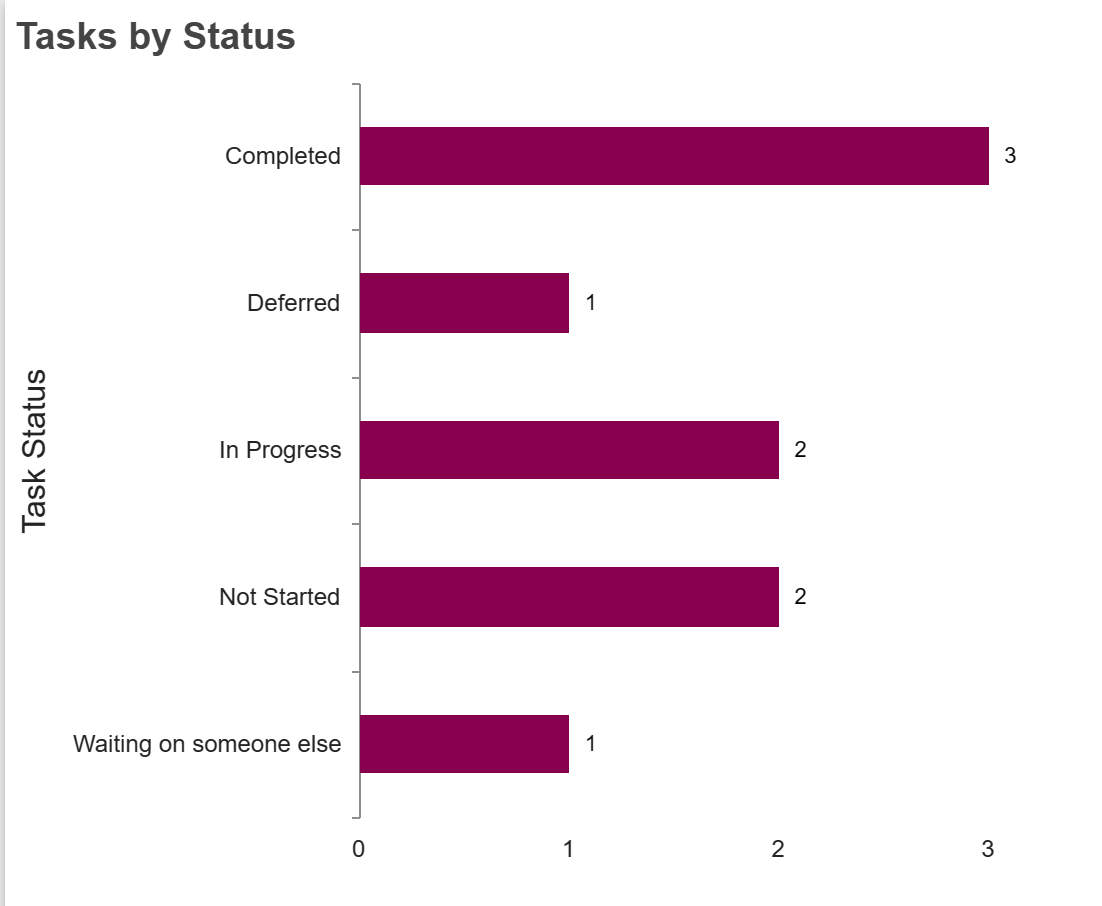
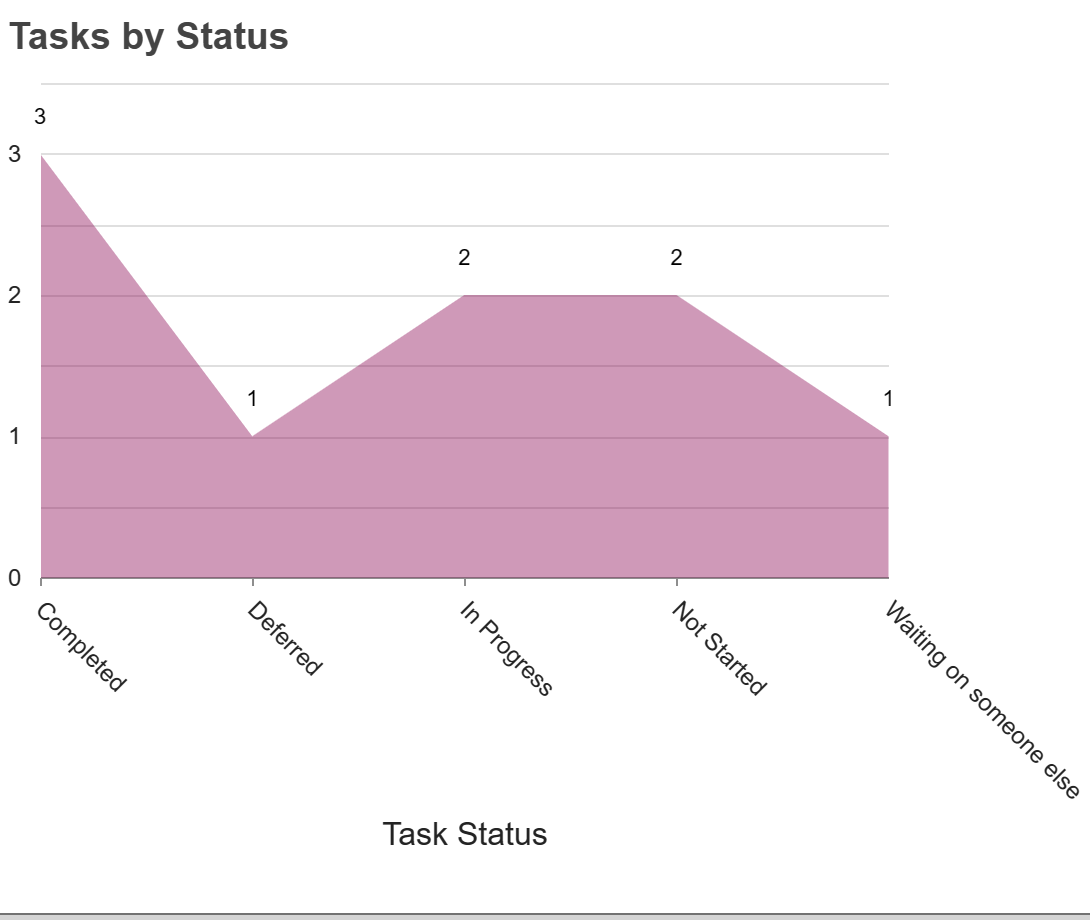
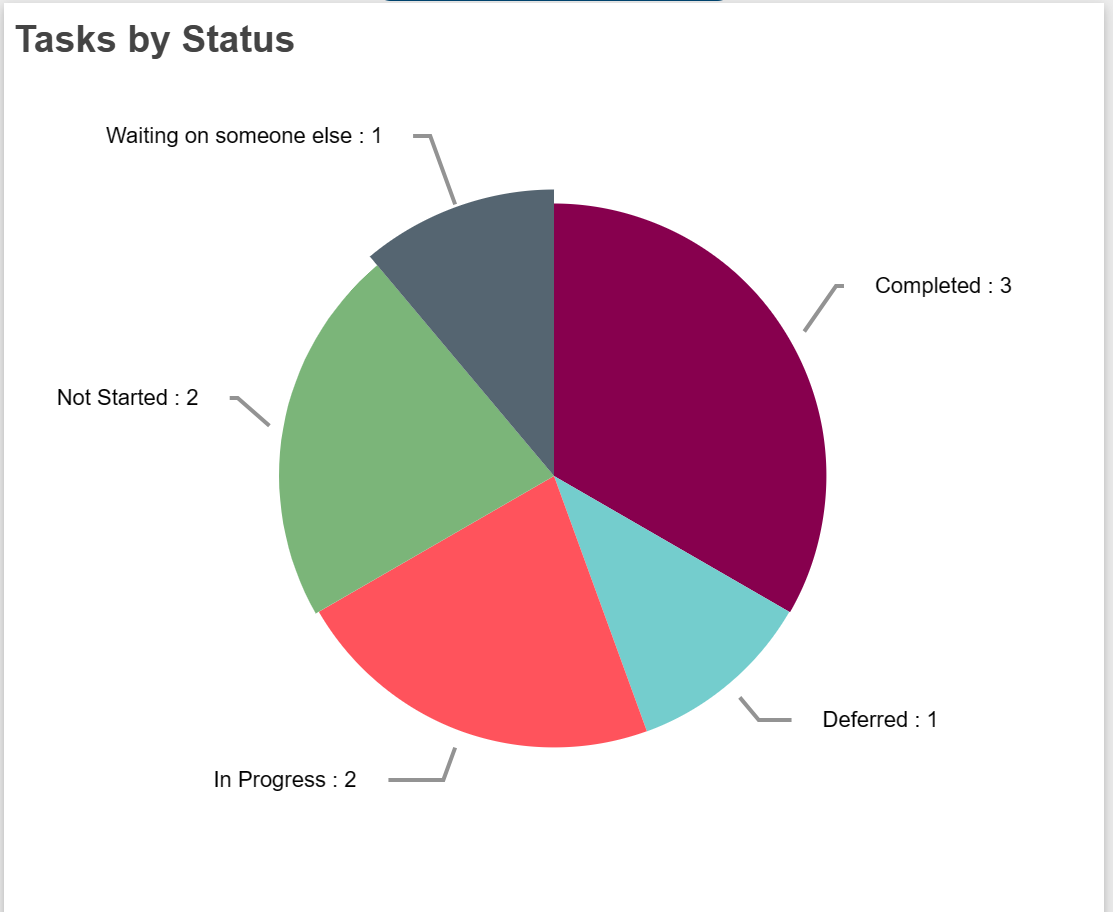
There are 14 types of Charts. Some are displayed below.
Some Examples of Chart Types:
•Line
•Column
•Bar
•Area
•Pie
•Funnel