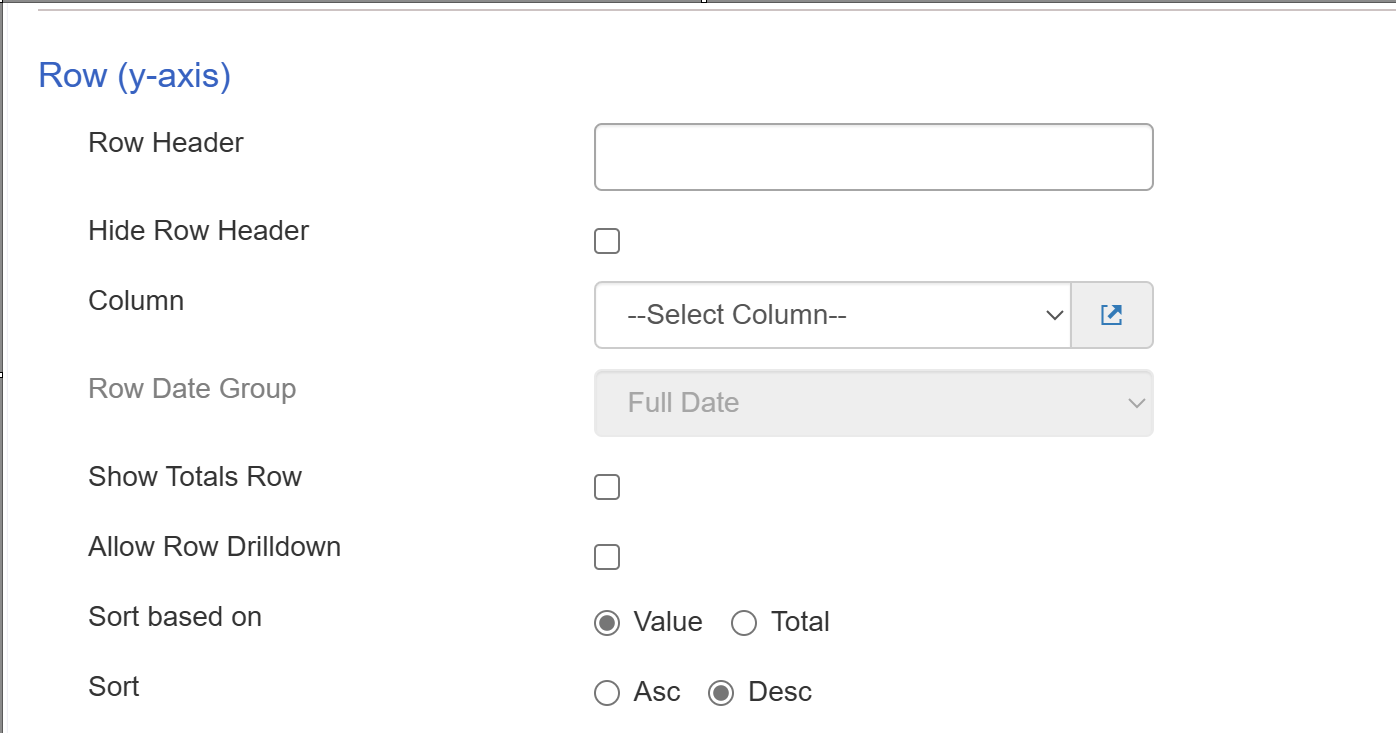
The Row field is an optional secondary column to represent the data in the report. This row axis adds another means of measuring the data. In a chart, the row is shown by categorizing the column axis by color, in terms of the row’s value. A color key will be included to make the data easy to read. In a table, the row field will simply represent the rows of the table.
In a table report, the Show Totals Row setting will calculate the sums of the items within each row.
The Allow Row Drilldown setting will create a feature of the report, that when each row of the table or chart is selected, will open the list view with the filter of only those items that are within the row, in the SharePoint list view.
The Sort Based On setting will either enable the Sort setting to sort by the value of each row, or the total, which is referring to the total count of the items within that row.
The Sort setting will sort the rows in ascending or descending order either numerically or alphabetically, depending on the type of row.