‘Problem – Staff – Workspace’ page show Reports for
1.My Open Problems by Priority and Category
2.My Tasks by Status
3.My Resolved Problems by Week
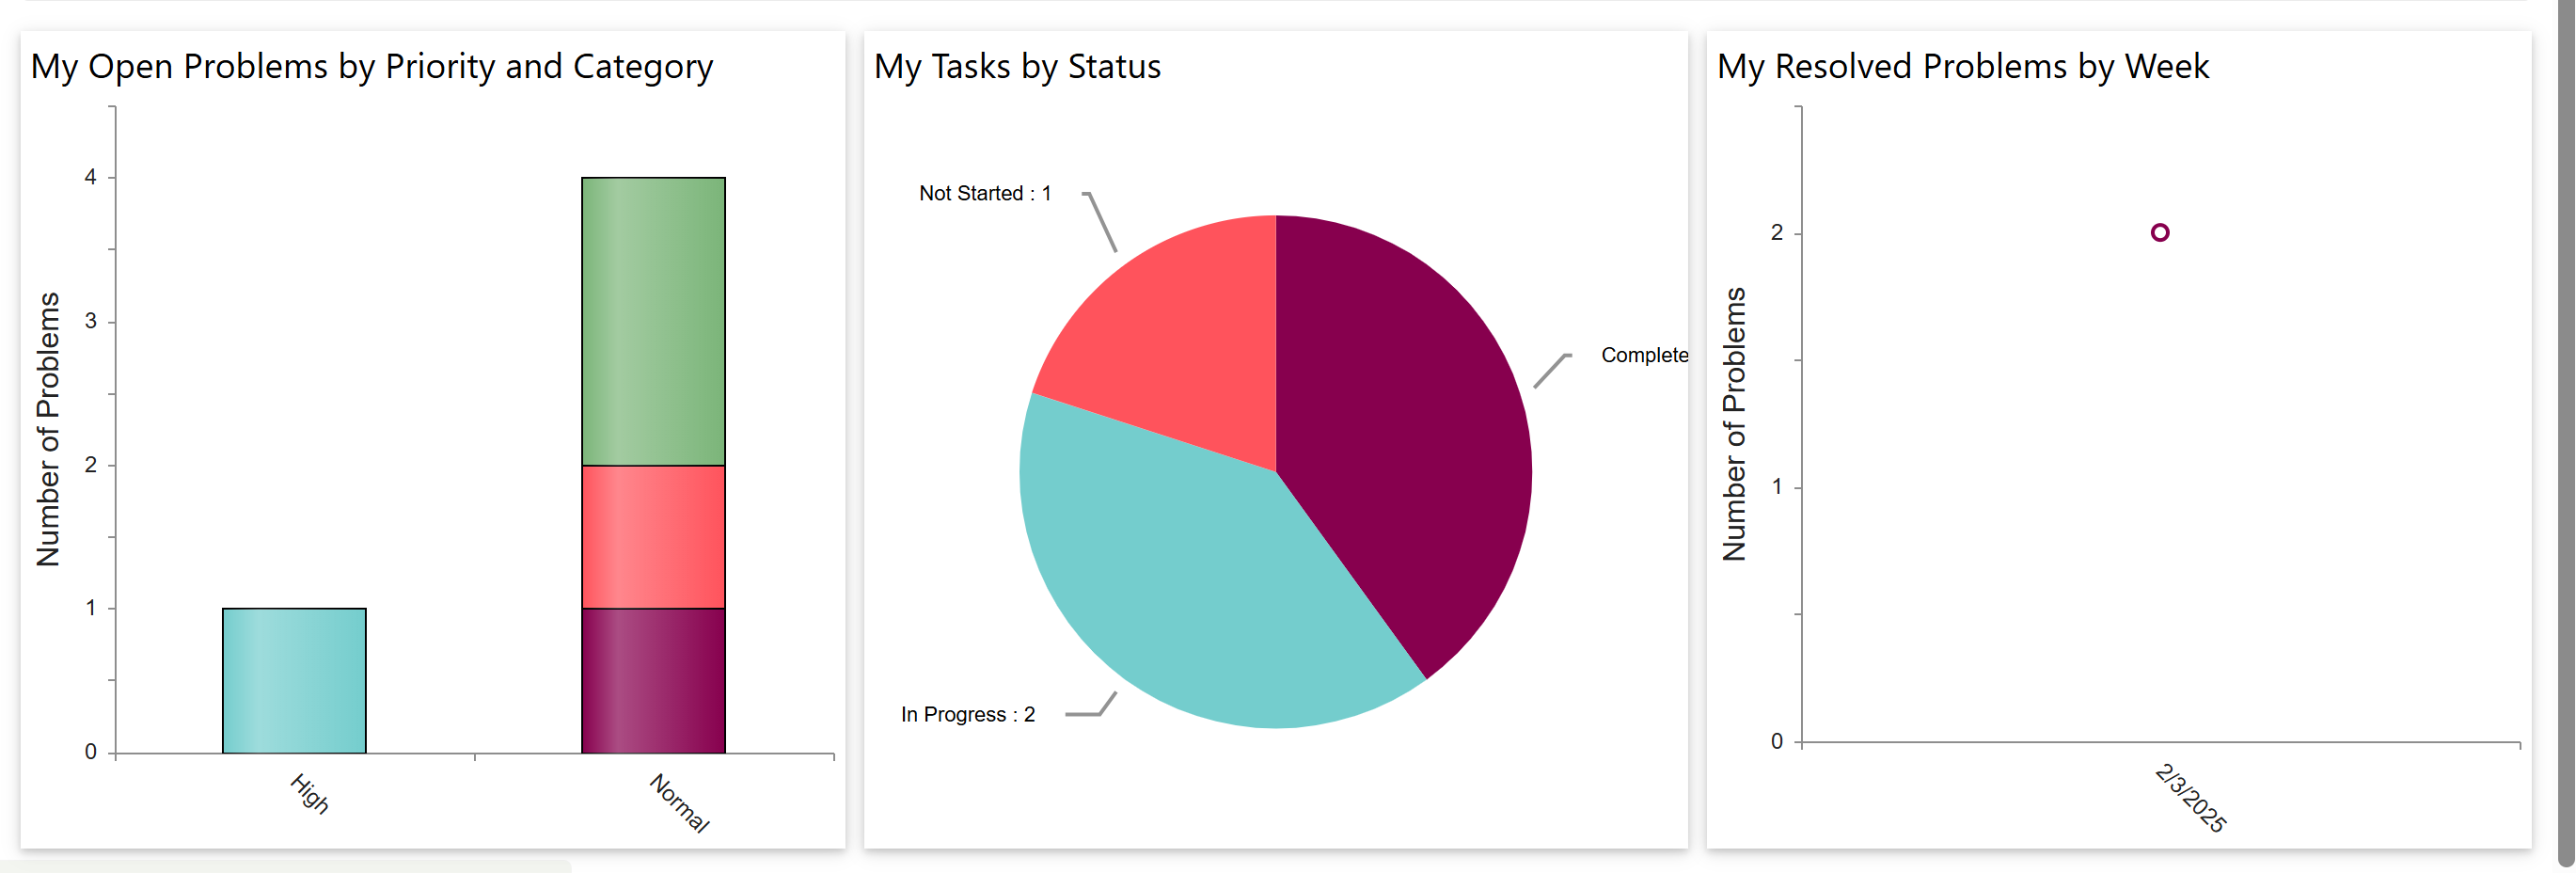
•My Open Problems by Priority and Category
a)This bar chart shows how many open problems you currently have.
b)The data is grouped by priority (e.g., High, Normal) on the x-axis.
c)Each bar is colour-stacked by category, helping you see the types of problems under each priority level.
d)For example, you have 1 high-priority problem and 4 normal-priority problems across different categories.
•My Tasks by Status
a)This pie chart displays the status of tasks assigned to you.
b)It shows how many tasks are Complete, In Progress, or Not Started.
c)For example, you have:
i.2 tasks in progress
ii.1 task not started
iii.The remaining are completed
•My Resolved Problems by Week
a)This point chart shows the number of problems you resolved each week.
b)It helps track your problem resolution activity over time.
c)In this image, you resolved 2 problems in the week of 2/2025.