‘Ticket – Staff – Workspace’ page also show Reports for
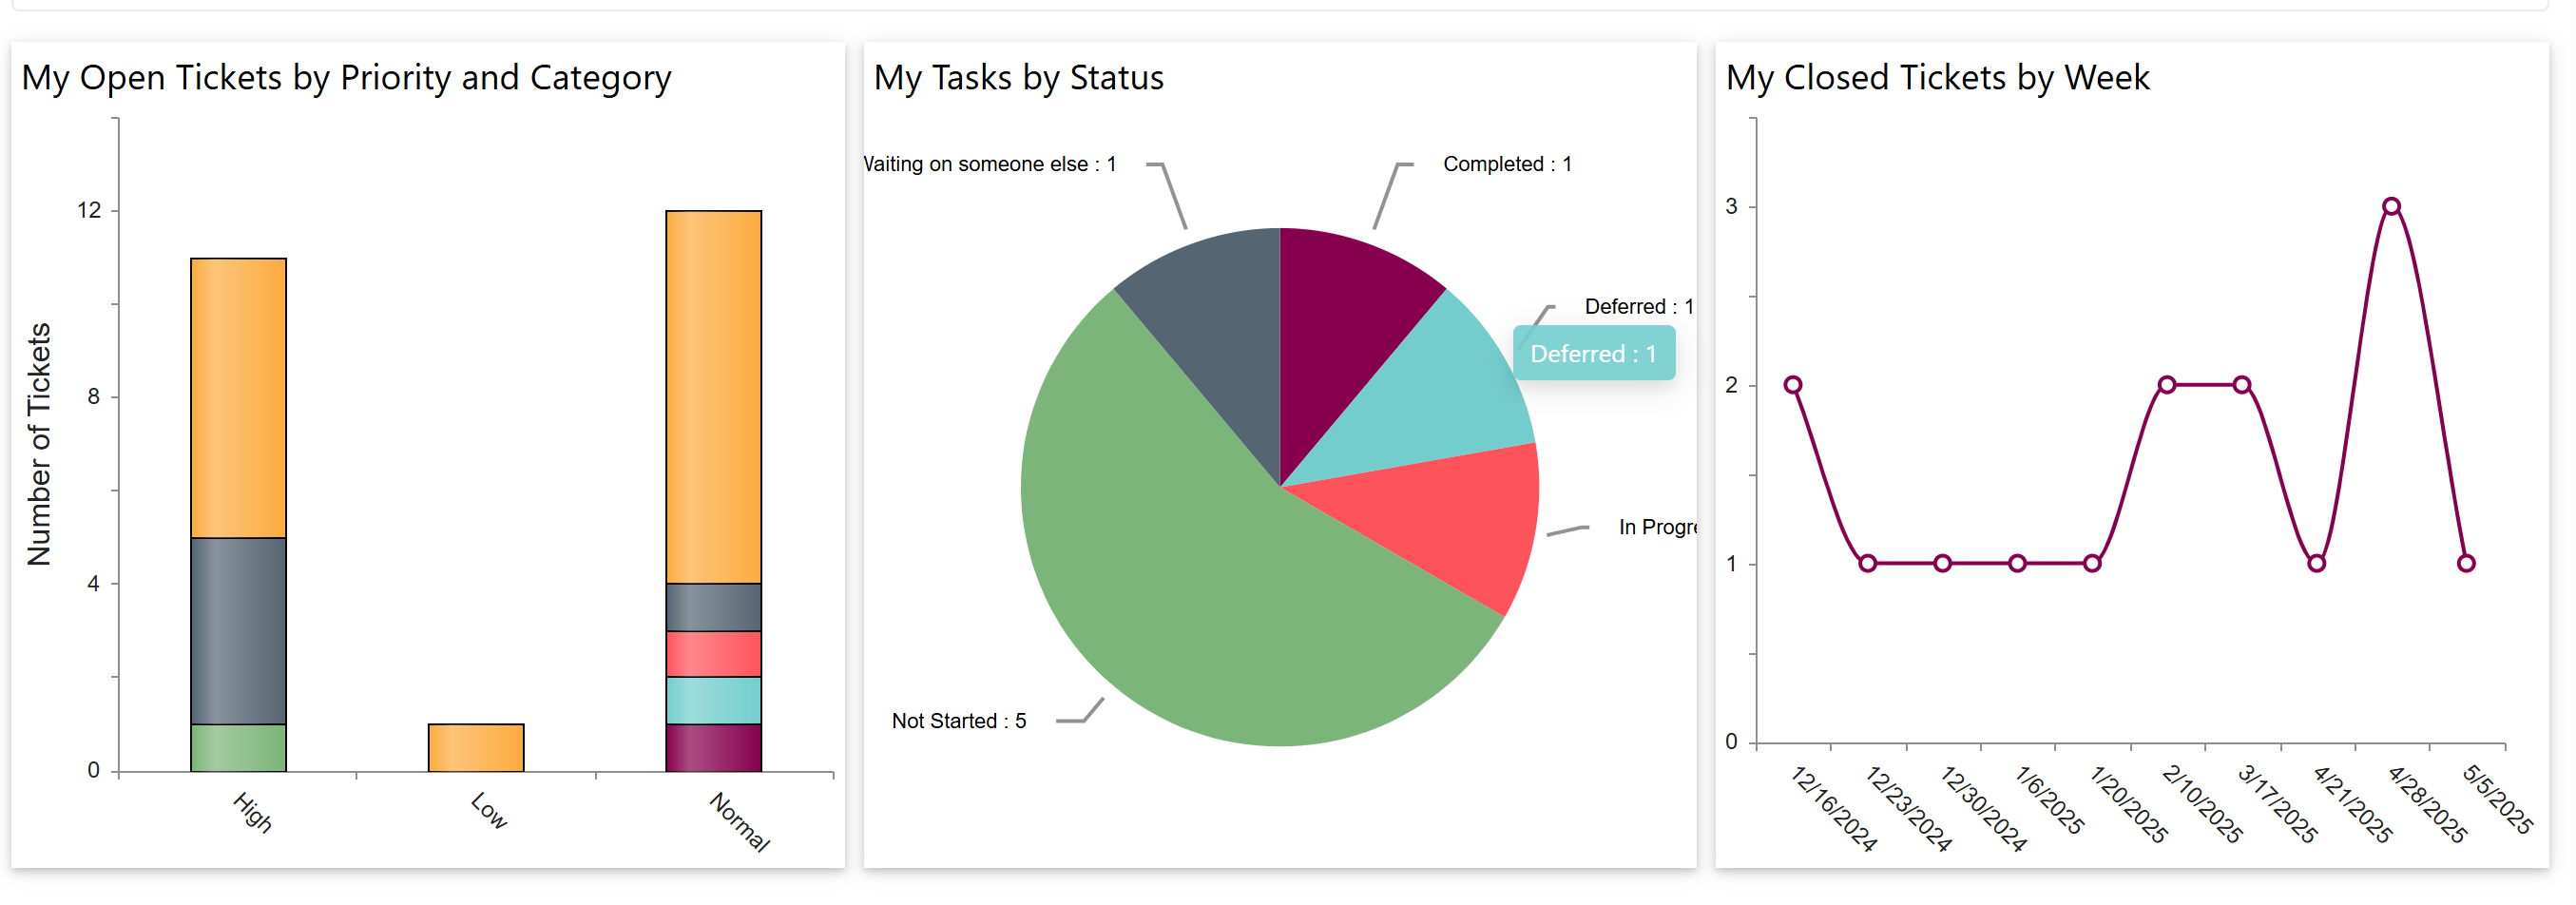
1. My Open Tickets by Priority and Category
•Bar chart showing how many open tickets you have by priority (High, Low, Normal).
•Each bar is stacked by category, helping identify where the workload is heaviest.
•Most tickets are in High and Normal priority.
2. My Tasks by Status
•Pie chart showing the status of your tasks (e.g., Not Started, In Progress, Completed).
•Majority are Not Started, followed by tasks in progress or deferred.
•Helps track personal task progress.
3. My Closed Tickets by Week
•Line graph showing how many tickets you closed each week.
•Shows weekly productivity trends and spikes in closures (e.g., a peak of 3 tickets closed on April 28, 2025).